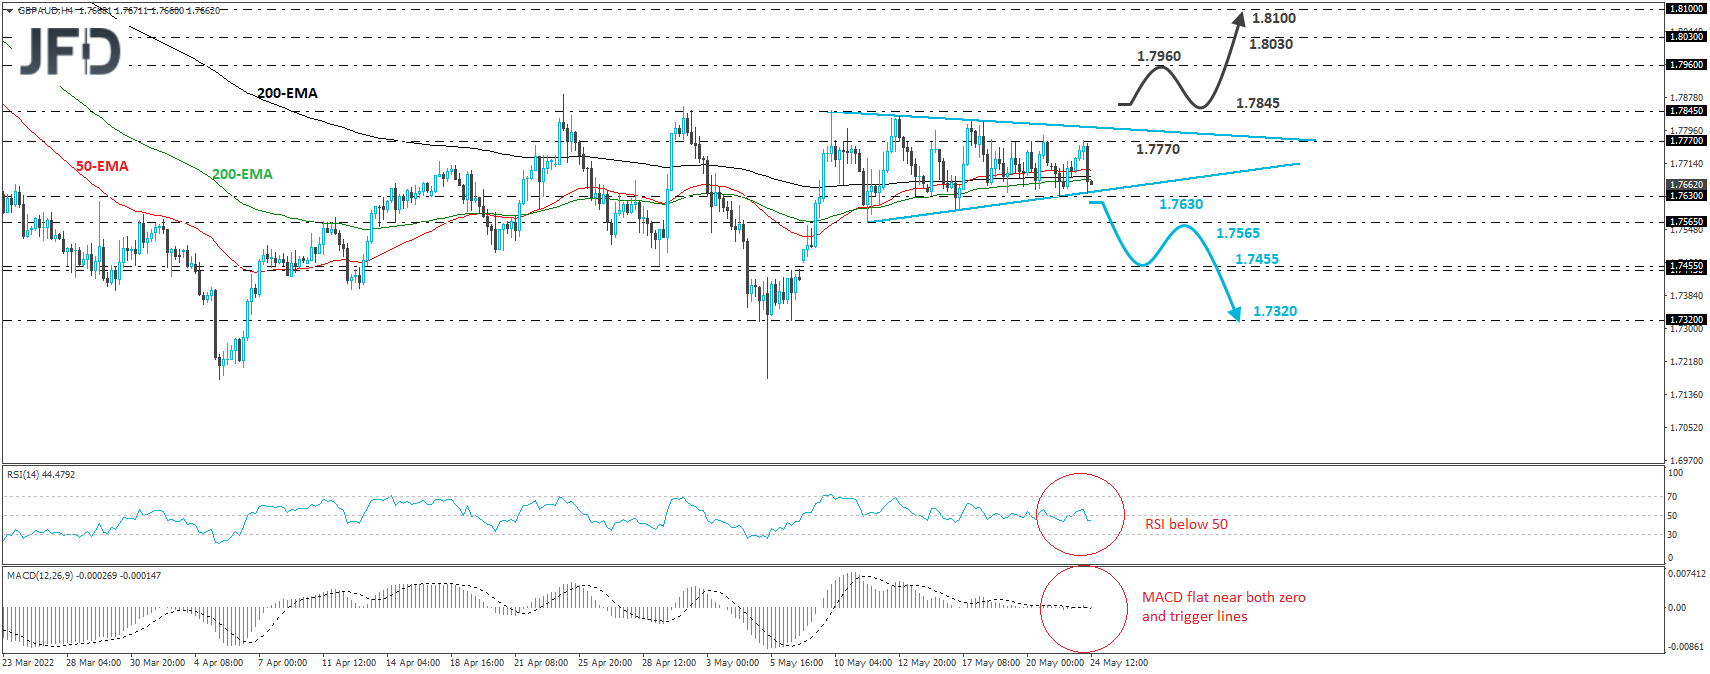
GBP/AUD traded lower on Tuesday, after it hit resistance at 1.7770. However, the slide was stopped near the lower bound of the symmetrical triangle that’s been containing the price action since May 10th. As long as the pair stays within that pattern, we will hold a flat stance.
In order to start examining more declines, we would like to see a clear dip below the 1.7630 zone, which is marked as a support by the low of May 23rd. This could signal the downside exit of the triangle and perhaps initially target the low of May 11th, at 1.7565. If the bears are strong enough to overcome that hurdle as well, then we may see them pushing towards the 1.7455 level, marked by the low of April 29th, or the 1.7445 barrier, marked by the high of May 6th. Another break, below 1.7445 could carry more declines, perhaps towards the low of that day, at 1.7320.
Shifting attention to our short-term oscillators, we see that the RSI fell back below 50, which indicates bearish momentum, but the MACD remains flat near both its zero and trigger lines, adding credence to our choice of waiting for an exit out of the triangle before examining the next directional move.
The outlook could turn bullish upon a break above 1.7845, a territory that acted as a key resistance between April 25th and May 10th. This could confirm the upside exit out of the triangle and could pave the way towards the 1.7960 zone, marked by the inside swing low of March 17th. Another break, above that barrier, could target the high of that day, at around 1.8030, or the peak of the day before, at around 1.8100.
Disclaimer:
The content we produce does not constitute investment advice or investment recommendation (should not be considered as such) and does not in any way constitute an invitation to acquire any financial instrument or product. The Group of Companies of JFD, its affiliates, agents, directors, officers or employees are not liable for any damages that may be caused by individual comments or statements by JFD analysts and assumes no liability with respect to the completeness and correctness of the content presented. The investor is solely responsible for the risk of his investment decisions. Accordingly, you should seek, if you consider appropriate, relevant independent professional advice on the investment considered. The analyses and comments presented do not include any consideration of your personal investment objectives, financial circumstances or needs. The content has not been prepared in accordance with the legal requirements for financial analyses and must therefore be viewed by the reader as marketing information. JFD prohibits the duplication or publication without explicit approval.
CFDs are complex instruments and come with a high risk of losing money rapidly due to leverage. 72.99% of retail investor accounts lose money when trading CFDs with the Company. You should consider whether you understand how CFDs work and whether you can afford to take the high risk of losing your money. Please read the full Risk Disclosure.
Copyright 2022 JFD Group Ltd.