Gbp Usd : 09/07/2014
Our Preference: Buy above 1.7120 With the target of 1.7160 & 1.200 stoploss of 1.7060
Alternative Scenario: Nill Upto closing below 1.7000
Technical Commentary: In 4 hours chart & 1 hour chart gbpusd was trading above the triangle pattern and it was trading in yearly high, so always keep move on with stop loss with the buying trend.

Gbp Usd : 10/07/2014
Our Preference: Buy above 1.7120 With the target of 1.7160 & 1.200 stoploss of 1.7060
Alternative Scenario: Nill
Technical Commentary: Gbpusd was trading above the triangle pattern yesterday it was broken and it was closed above the triangle pattern, it was trading in yearly high, so always keep move on with stop loss with the buying trend.

Gbp Usd : 15/07/2014
Our Preference: Sell Below 1.7100 With the target of 1.7060 & 1.7040 stoploss of 1.7130
Alternative Scenario: Nill
Technical Commentary: Yesterday Gbp usd was broken the lower trend of the triangle pattern and it was trading below lower trend line so we can except further sell off upto kepp support levels.

Gbp Usd : 16/07/2014
Our Preference: Sell Below 1.7160 With the target of 1.7120 & 1.7040 stoploss of 1.7200
Alternative Scenario: Nill
Technical Commentary: Yesterday Gbp usd was tested yearly high and closed below last week high and reback into the triangle pattern ,so we can except further sell off upto key support levels.

Pips Profit.
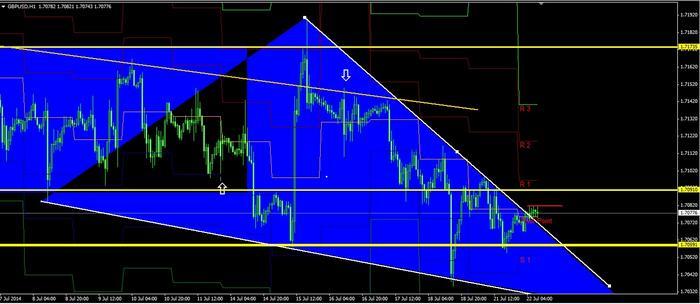
Gbp Usd : 22/07/2014
Our Preference: Buy above 1.7060 With the target of 1.7120 stoploss of 1.7020
Alternative Scenario: Nill
Technical Commentary: Gbp was trading above the triangle pattern and it breaked upper resistance line of the triangle pattern, so we can except buy off upto next key resistance levels.
[B]Gbp Usd : 23/07/2014
Our Preference: Buy above 1.7060 With the target of 1.7120 stoploss of 1.7020
Alternative Scenario: Nill
Technical Commentary: Gbp 1 hour chart was trading in the triangle pattern and it breaked upper resistance line of the triangle pattern, so we can except buy off upto next key resistance levels.
[/B]

[B]Gbp Usd : 24/07/2014
Our Preference:Sell Below 1.7060 With the target of 1.7010 & 1.6970 stoploss of 1.7100
Alternative Scenario: Nill
Technical Commentary: Gbp 4 hour chart was broken the triangle pattern on lower side and it breaked lower support line ,so we can except sell off upto next key Support levels.
[/B]


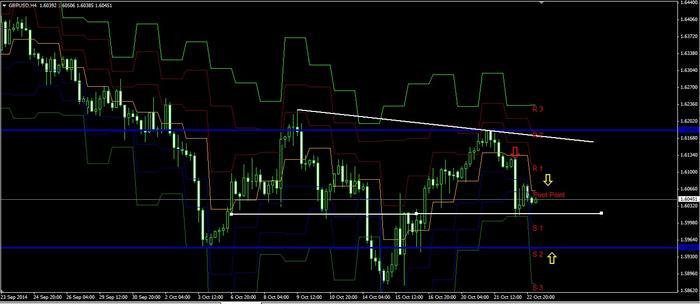
Gbp Usd : 22/10/2014
Our Preference:Sell Below 1.6120 With the target of 1.6060 stoploss of 1.6150
Alternative Scenario: Nill
Technical Commentary: Gbp 4 hour chart was trading near upper trend line with key resistance line, so we can except sell off upto next key Support levels.
Our subscribers are receive new FOREX SIGNALS for (GBP/USD) -http://www.Centreforex.com/
Signal Cost of 100$ Per month Special offer. Monthly we are giving assured 300 Pips Profit.


Gbp Usd : 23/10/2014
Our Preference:Sell Below 1.6080 With the target of 1.6000 stoploss of 1.6130
Alternative Scenario: Nill
Technical Commentary: Gbp 4 hour chart was trading in between key resistance upper trend line and key support line,In daily chart its was broken lower trend line, so we can sell near upper trend line upto next key support levels.In 1 hour chart triangle pattern formed.
Gbp/Usd : 27/02/2015
Our Preference: Sell below1.5450 with target of 1.5360 in extension
Alternative Scenario: Nill
Technical Commentary: In daily chart :- Yesterday Gbp/Usd was broken lower trend line and also broken key support line So its confirming that for down :- We have shown in image.
In 4 hours chart & 1 hour chart Gbp/Usd was broken the equidistance channel lines on lower side and its broken key support level So its confirming that on down side, we can sell near key resistance levels and expect correction upto next key support levels 1.5330 :- We have shown in image.


Our Preference: Sell below 1.5450 with target of 1.5360 & 1.5200 in extension,
Alternative Scenario: Nill,
Technical Commentary: In weekly chart GbpUsd was trading below key resistance line @ 1.5500 level and last week its was closed lower and its couldn’t able to break a last week before week high. In daily chart :- Gbp/Usd was forming intraday key support level and its trading below key resistance line, So we can sell near resistance @ 1.5500 its confirming that for down :- We have shown in image. In 4 hours chart & 1 hour chart Gbp/Usd was broken the equidistant channel lines on lower trend line side and its broken key support level So its confirming that on down side, we can sell near key resistance levels @ 1.5450 and expect correction upto next key support levels 1.5330 :- We have shown in image.


Gbp/Usd : 04/03/2015 Technical Analysis Report From Centreforex
Our Preference: Sell below1.5400 with target of 1.5330 & 1.5300 in extension
Alternative Scenario: Nill
Technical Commentary: In daily chart :- yesterday Gbp/Usd was closed below intraday key resistance line, So we can sell near resistance @ 1.5400 :- We have shown in image.
In 4 hours chart & 1 hour chart Gbp/Usd was broken the equidistant channel lines on lower trend line and its trading in triangle pattern with near upper trend line so we can sell below 1.5400 and expect correction upto next key support levels 1.5340 & 1.5300 :- We have shown in image.


Gbp/Usd : 05/03/2015 Technical Analysis Report From Centreforex
Our Preference: Sell below1.5300 with target of 1.5200.
Alternative Scenario: Buy above 1.5350 for the target of 1.5500
Technical Commentary: In daily chart :- yesterday Gbp/Usd was broken key support level line, Now the previous support line acting as key resistance line level, So we can sell near resistance @ 1.5300 upto next level 1.5200 :- We have shown in image.
In 4 hour chart Gbp/Usd was trading below intraday upper trend line and Gbp/Usd was started to trade between key support level and key resistance level so we can except sideways movements.
In 1 hour chart Gbp/Usd was broken the equidistant channel lines on lower side,Now the previous support line acting as key resistance line level.So we can sell near resistance level :- We have shown in image.
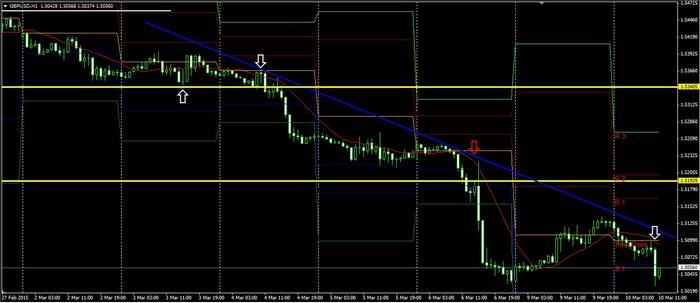
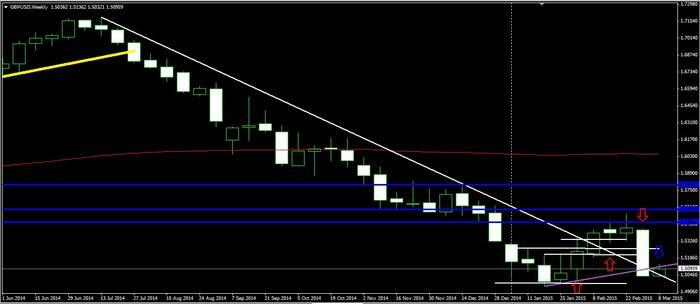
Gbp/Usd : 10/03/2015 Technical Analysis Report From Centreforex
Our Preference: Sell below1.5100 with target of 1.5030.
Alternative Scenario: Nill
Technical Commentary:
In Weekly chart :- Last week GbpUsd was closed lower and closed below last 3 weeks low and its broken lower trend line and its closed below lower trend line, now previous lower trend line become acting as resistance line so we can sell near the trend line :- We have shown in image.
In daily chart :- Gbp/Usd was broken key support level line, Now the previous support line acting as key resistance line level, So we can sell near resistance @ 1.5030 :- We have shown in image.
In 4 hour chart Gbp/Usd was broken equidistant channel line on lower side line so now 1.5100 acting as key resistance level and In 1 hour chart Gbp/Usd was trading in the near upper trend line,:- We have shown in image.


Gbp/Usd : 11/03/2015 Technical Analysis Report From Centreforex
Our Preference: Sell below1.5080 with target of 1.5030.
Alternative Scenario: Nill
Technical Commentary:
In Weekly chart :- Last week GbpUsd was closed lower and closed below last 3 weeks low and its broken lower trend line and its closed below lower trend line, now previous lower trend line become acting as resistance line so we can sell near the trend line :- We have shown in image.
In daily chart :- Gbp/Usd was trading above the major key support level and trading below the upper trend line and Last 2 days its trading in range bound pattern with key support and key resistance :- We have shown in image.
In 4 hour chart Gbp/Usd was trading in the equidistant channel and In 1 hour chart Gbp/Usd was trading in the near upper trend line So we can sell near upper trend line ,:- We have shown in image.


Gbp/Usd : 12/03/2015 Technical Analysis Report From Centreforex
Our Preference: Sell below1.5000 with target of 1.4900.
Alternative Scenario: Nill
Technical Commentary:
In Weekly chart :- Last week GbpUsd was closed lower and closed below last 3 weeks low and its broken lower trend line and its closed below lower trend line, now previous lower trend line become acting as resistance line so we can sell near the trend line :- We have shown in image.
In daily chart :- Yesterday Gbp/Usd was broken last month low and closed below key support level 1.5000 ,so last month low acting as key resistance so we can sell near resistance level. trading above the major key support level and trading below the upper trend line and Last 2 days its trading in range bound pattern with key support and key resistance :- We have shown in image.
In 4 hour chart and 1 hour chart Gbp/Usd was trading in the equidistant channel near upper channel line, So we can sell near upper trend line :- We have shown in image.


Gbp/Usd : 16/03/2015 Technical Analysis Report From Centreforex
Our Preference: Sell below1.4820 with target of 1.4730 .
Alternative Scenario: Nill
Technical Commentary:
In weekly chart :- Last week GbpUsd was closed below last 2 years low of year 2013,so its confirming that for selling trend so be caution on buy side, without stoploss don’t enter, so we can sell near the major key resistance of 1.4800 levels :- We have shown in image.
In daily chart :- Gbp/Usd was broken last 2 years low and closed below key support level 1.4820 :- We have shown in image.
In 4 hour chart and 1 hour chart Gbp/Usd was trading in the equidistant channel with intraday upper trend line, So we can sell near upper trend line :- We have shown in image.


[B]Gbp/Usd : 17/03/2015 Technical Analysis Report From Centreforex
Our Preference: Sell below1.4820 with target of 1.4730 & 1.4620.
Alternative Scenario: Nill
Technical Commentary:
In weekly chart :- Last week GbpUsd was closed below last 2 years low of year 2013,so its confirming that for selling trend so be caution on buy side, without stoploss don’t enter, so we can sell near the major key resistance of 1.4820 levels :- We have shown in image.
In daily chart :- Gbp/Usd was broken last 2 years low and its closed below major level of 1.4820 and its started move towards the lower trend line:- We have shown in image.
In 4 hour chart and 1 hour chart :- Gbp/Usd was trading in the equidistant channel lines and its trading near to upper channel line with triangle pattern So we can sell near upper channel line and trend line :- We have shown in image.
[/B]
Gbp/Usd : 19/03/2015 Technical Analysis Report From Centreforex
Our Preference: Buy above 1.4800 with target of 1.4900.
Alternative Scenario: Nill
Technical Commentary: In daily chart :- Gbp/Usd was bounce back from the key support line of lower trend line and Gbp/Usd was broken the key resistance level 1.4800 and yesterday its closed above the key the resistance level of 1.4800 :- We have shown in image.
In 4 hour chart and 1 hour chart :- Gbp/Usd was broken the equidistant channel lines on upper side and now its trading above the upper trend line so we can buy near to channel line and upper trend line :- We have shown in image.


