Gbp/Usd : 20/03/2015 Technical Analysis Report From Centreforex
Our Preference: Sell below 1.4820 for the target of 1.4700.
Alternative Scenario: Nill
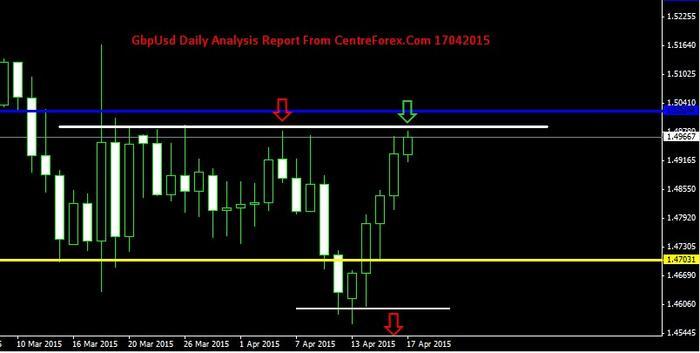
Technical Commentary: In daily chart :- Yesterday Gbp/Usd closed below 2013 yearly low and close below support horizontal line 1.4800 so we can sell near key support horizontal line @1.4800 level :- We have shown in image.
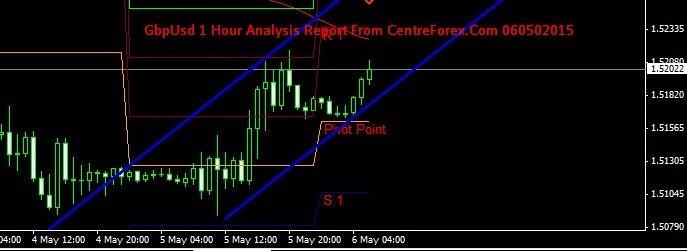
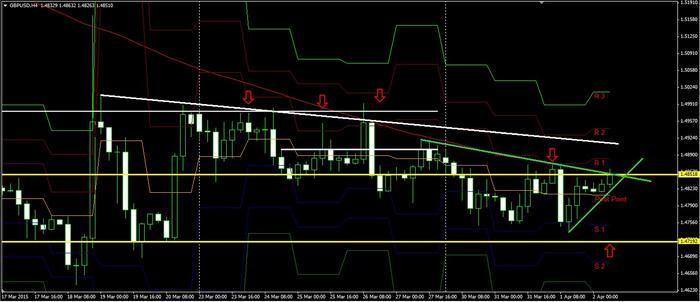
In 4 hour chart and 1 hour chart :- Gbp/Usd was trading in the triangle pattern and trading below key resistance level so we can sell near key resistance level and today we can except sideways moments in between upper trend line and lower trend line :- We have shown in image.
Gbp/Usd : 23/03/2015 Technical Analysis Report From Centreforex
Our Preference: Sell below 1.5000 for the target of 1.4850.
Alternative Scenario: Nill
Technical Commentary: In weekly chart : Gbp/Usd was closed on higher side after tested back from May2013 low,now its trading in the key resistance level is 1.5000 level :- We have shown in attached image.
In Daily chart, Eur/Usd was trading below key support levels and yesterday it was closed above the key support level 1.4830 level So we can except upto next key resistance level 1.5000.
In 4 hour chart and 1 hour chart :- Gbp/Usd was trading in the triangle pattern near upper trend line and trading below key resistance level so we can sell near key resistance level and upper trend line so today we can sell near key resistance @ 1.5000 Levels:- We have shown in image.
Gbp/Usd : 25/03/2015 Technical Analysis Report From Centreforex
Our Preference: Sell below 1.5000 for the target of 1.4850.
Alternative Scenario: Nill
Technical Commentary: In Daily chart, Gbp/Usd was trading in range bound pattern between 1.5000 to 1.4700 levels and its trading with upper trend line and we have a good major support levels of 1.4820 & 1.4720 ,So we can except to sell below upper trend line 1.5000 levels :- We have shown in attached image.
In 4 hour chart and 1 hour chart :- Gbp/Usd was trading in the triangle pattern and its trading near upper trend line and its trading below the key resistance level so we can sell near key resistance level and upper trend line @ 1.5000 levels :- We have shown in attached image.
Gbp/Usd : 26/03/2015 Technical Analysis Report From Centreforex
Our Preference: Sell below 1.4950 for the target of 1.4850 & 1.4750.
Alternative Scenario: Nill
Technical Commentary: In Daily chart, Gbp/Usd was trading in range bound pattern between 1.5000 to 1.4700 levels and its trading with upper trend line and we have a good major support levels of 1.4820 & 1.4720, so we can except to sell below upper trend line 1.5000 levels for the target of 1.4820 :- We have shown in attached image.
In 4 hour chart and 1 hour chart :- Gbp/Usd was trading in the triangle pattern and its trading below the key resistance level so we can sell below key resistance level and upper trend line 1.5000 levels :- We have shown in attached image.
Gbp/Usd : 30/03/2015 Technical Analysis Report From Centreforex
Our Preference: Sell below 1.4780 for the target of 1.4700 & 1.4650.
Alternative Scenario: Nill


Technical Commentary: In Weekly Chart : Gbp/Usd was trading in the range bound pattern between key resistance @ 1.5020 and key support level @ 1.4710 so we can except sideways movements :- We have shown in attached image
In Daily chart,4 hour chart and 1 hour chart, Gbp/Usd was trading in the triangle pattern so we have to watch, which side its was breaking.On breaking side we have to move further :- We have shown in attached image.
Gbp/Usd : 31/03/2015 Technical Analysis Report From Centreforex
Our Preference: Sell below 1.4820 for the target of 1.4740.
Alternative Scenario: Nill
Technical Commentary: In 4 hour chart and 1 hour chart, Gbp/Usd was trading in the Equidistant channel lines and it was trading in the range bound pattern between key resistance level and key support level, so we can sell below resistance level 1.4820 :- We have shown in attached image.
Gbp/Usd : 01/04/2015 Technical Analysis Report From Centreforex
Our Preference: Sell below 1.4870 for the target of 1.4820.
Alternative Scenario: Nill Today
Technical Commentary: In Weekly Chart : Gbp/Usd was trading in the range bound pattern between key resistance @ 1.5020 and key support level @ 1.4710 and yesterday gbp/usd bounced back from last week low so we can except sideways movements :- We have shown in attached image
In Daily chart and In 4 hour chart: Gbp/Usd was trading in the triangle pattern so we can except range bound pattern between upper trend line and lower trend line :-
In 1 hour chart, Gbp/Usd was trading in the equidistant channel lines now its was trading near upper channel line so we can sell below upper channel line for the target upto next support level :- We have shown in attached image.
Gbp/Usd : 02/04/2015 Technical Analysis Report From Centreforex
Our Preference: buy above 1.4870 for the target of 1.4950 & 1.5000 levels.
Alternative Scenario: Nill Today
Technical Commentary: In Daily chart, GbpUsd was trading in the triangle pattern and major key support level was formed @ 1.4750 ( Last 3 days low ) so we can keep stoploss below last 3 days low and we can buy near intraday support levels :- We have shown in attached image.
In 4 hour chart,Gbp/Usd was trading in the triangle pattern and now its was trading near upper trend line and key resistance level 1.4850 so we can buy above 1.4850 levels for the target of 1.4930 level :- We have shown in attached image.
In 1 hour chart, Gbp/Usd was trading in the equidistant channel lines now its was trading near upper channel line 1.4850 levels so we can buy above 1.4850 level upto intraday resistance level :- We have shown in attached image.
Gbp/Usd : 13/04/2015 Technical Analysis Report From Centreforex
Our Preference: Sell Below 1.4720 for the target of 1.4650 & 1.4600 levels.
Alternative Scenario: Nill Today
Technical Commentary: Last week GbpUsd was closed on lower side and closed below key support level 1.4720 and next key support level is coming around 1.4250 levels :- We have shown in attached image.
In Daily chart :- GbpUsd was broken the major key support level of 1.4700 so we can sell below key resistance level of 1.4700 :- We have shown in attached image.
In 4 hour chart,Gbp/Usd was trading below the key resistance level of 1.4650 and 1.4720 levels so we can sell below this 2 major resistance level :- We have shown in attached image.
Gbp/Usd : 14/04/2015 Technical Analysis Report From Centreforex
Our Preference: Sell Below 1.4720 for the target of 1.4650 & 1.4600 levels.
Alternative Scenario: Nill Today
Technical Commentary: In Daily chart :- GbpUsd was broken the major key support level of 1.4700 so we can sell below key resistance level of 1.4700 so today we can except upto key resistance level of 1.4720 , In 4 hour chart,Gbp/Usd was trading below the major key resistance level of 1.4720 levels so we can sell below this 2 major resistance level :- We have shown in attached image.
Gbp/Usd : 15/04/2015 Technical Analysis Report From Centreforex
Our Preference: Sell Below 1.4730 for the target of 1.4650 & 1.4600 levels.
Alternative Scenario: Nill Today
Technical Commentary: In Daily chart :- GbpUsd was trading in the long term equidistant channel lines and yesterday closed above the major key support level of 1.4720 so we can buy above the key support level 1.4720 and beware without stoploss don’t entre keep tight stoploss above 1.4660 levels
In 4 hour chart and 1 hour chart : Gbp/Usd was trading in the triangle pattern and trading above the major key resistance level of 1.4720 levels so we can sell below upper trend line with stoploss above yesterday high :- We have shown in attached image.
Gbp/Usd : 17/04/2015 Technical Analysis Report From Centreforex
Our Preference: Sell Below 1.5000 for the target of 1.4850 & 1.4730 levels.
Alternative Scenario: Buy Above 1.5070 for the target of 1.5180 levels.
Technical Commentary: In Daily chart and 4 hours chart :- GbpUsd was trading in the range bound pattern between key resistance level 1.5000 and key support level 1.4700 so now it was trading in the below key resistance level so we can sell near key resistance level and we can wait upto next support levels :- which we have shown in attached image.
In 1 hour chart : Gbp/Usd was trading in the equidistance channel lines and its trading in the range bound pattern between the major key resistance level and key support levels :- which we have shown in attached image.
Gbp/Usd : 20/04/2015 Technical Analysis Report From Centreforex
Our Preference: Sell Below 1.4980 for the target of 1.4850 & 1.4730 levels.
Alternative Scenario: Nill.
Technical Commentary: In Daily chart:- GbpUsd was trading in the range bound pattern between key resistance level 1.5000 and key support level 1.4700 and now it was trading below key resistance level and yesterday it was closed on lower side and its closed like as inverse hammer pattern so we can sell near key resistance level and we can wait upto next support levels :- which we have shown in attached image.
In 4 hours chart :- GbpUsd was trading in the range bound pattern between key resistance level 1.5000 and key support level 1.4700 and now it was trading with lower trend line and In 1 hour chart :- Gbp/Usd was trading in the equidistant channel lines and its trading in the range bound pattern between the major key resistance level and key support levels :- which we have shown in attached image.
Gbp/Usd : 24/04/2015 Technical Analysis Report From Centreforex
Our Preference: Buy above 1.5030 for the target of 1.5100 & 1.5200 levels.
Alternative Scenario: Nill.
Technical Commentary: In Daily chart:- GbpUsd was broken the range bound pattern on higher side and its broken the key resistance level 1.5000 level and now its was trading with lower trend line :- which we have shown in attached image.
In 4 hours chart :- GbpUsd was trading in the equidistant channel lines and now its trading near lower trend line and trading near key support level of 1.5000 ,In 1 hour chart :- Gbp/Usd was moving with lower trend line and yesterday its broken major key resistance level 1.5000 so we can buy above 1.5000 levels :- which we have shown in attached image.
Gbp/Usd : 27/04/2015 Technical Analysis Report From Centreforex
Our Preference: Buy above 1.5080 for the target of 1.5200 levels.
Alternative Scenario: Nill.
Technical Commentary: In Weekly Chart :- GbpUsd was broken the major key resistance level 1.5000 level and last week GbpUsd pair was closed on higher side further we can except upto next resistance level 1.5250 levels.
In Daily chart:- GbpUsd was broken the range bound pattern on higher side and the pair broken the key resistance level 1.5000 so the pair confirming for buying side :- which we have shown in attached image.
In 4 hours chart :- GbpUsd was trading in the equidistant channel lines and the pair is broken the key resistance level so we can buy near lower channel line and key support level 1.5080
1 hour chart :- Gbp/Usd was broken the triangle pattern on upper side and the pair trading with lower trend line so we can buy near lower trend line :- which we have shown in attached image.
Gbp/Usd : 06/05/2015 Technical Analysis Report From Centreforex
Our Preference: Sell Below 1.5220 and 1.5280 levels for the target 1.5150 and 1.5080 levels.
Alternative Scenario: Nill

Technical Commentary: In Daily chart:- GbpUsd was broken the lower trend line and its broken major key support level 1.5280 and 1.5230 levels now the pair is trading near key resistance so we can except upto next key support 1.5000 levels :- which we have shown in attached image.
In 4 hours chart :- GbpUsd was trading with upper trend line and near key resistance level,In 1 hour chart :- Gbp/Usd was trading in equidistant channel, so we can sell near key resistance levels :- which we have shown in attached image.
Gbp/Usd : 11/05/2015 Technical Analysis Report From Centreforex
Our Preference: Sell Below 1.5500 for the target 1.5280 levels.
Alternative Scenario: Nill

Technical Commentary: In Weekly Chart and In Daily chart :- Last week Gbp/Usd was closed near upper trend line and key resistance 1.5500, so we can except sell off near key resistance level for the target upto next support 1.5220 levels :- which we have shown in attached image.
In 4 hours chart and 1 hour chart :- GbpUsd was trading in the range bound pattern between key resistance and key support levels:- which we have shown in attached image.
Gbp/Usd : 27/05/2015 Technical Analysis Report From Centreforex
Our Preference: Sell Below 1.5450 for the target 1.5400 and 1.5280 levels.
Alternative Scenario: Nill
Technical Commentary: In Daily chart :- Gbp/Usd was broken the strong lower trend line and closed below lower side so we got strong conformation for selling zone :- which we have shown in attached image.
In 4 hours chart :- GbpUsd was broken the triangle pattern on lower side and its broken the key support level lower trend line and key support level 1.5400.so we can except sell below 1.5450 levels upto next key support levels:- which we have shown in attached image.
In 1 Hour Chart :- GbpUsd was trading in the equidistant channel lines and its trading below the key resistance level.
Gbp/Usd : 03/06/2015 Technical Analysis Report From Centreforex
Our Preference: Buy above 1.5280 for the target 1.5400 levels.
Alternative Scenario: Nill
Technical Commentary: In Daily chart :- Yesterday Gbp/Usd was broken the strong key resistance level 1.5280 and closed above the key resistance level so its conforming for the buying side :- which we have shown in attached image.
In 4 hour chart and 1 hour chart :- GbpUsd was trading in the equidistance channel lines and trading above the key support level so further we can except upto next resistance level :- which we have shown in attached image.
Gbp/Usd : 01/09/2015 Technical Analysis Report From Centreforex
Our Preference: Sell Below 1.5500 for the target 1.5400 and 1.5280 levels.
Alternative Scenario: Nill
Technical Commentary: In Weekly Chart :- Last week Gbp/Usd was broken the lower trend of equidistant channel lines and its broken the key support level, so we can sell near key resistance level.
In Daily chart :- Gbp/Usd was trading near key support level 1.5350 and Pervious support levels also coming at 1.5350 and last 2 days low was formed as key support levels, so further we can except upto next resistance levels :- which we have shown in attached image.
In 4 hours chart :- GbpUsd was trading in the range bound pattern for last 2 days between key resistance and key support level.
In 1 Hour Chart :- GbpUsd was trading in the intraday triangle pattern now its was trading near upper trend line so we can except upto intraday support levels :- which we have shown in attached image.


