
Possible sale at fibo 61.8 at resistance 1.21497
or we can have a buy when 1.21497 breaks out and becomes a support
We have extremes on the cot chart, which could signal a reversal.
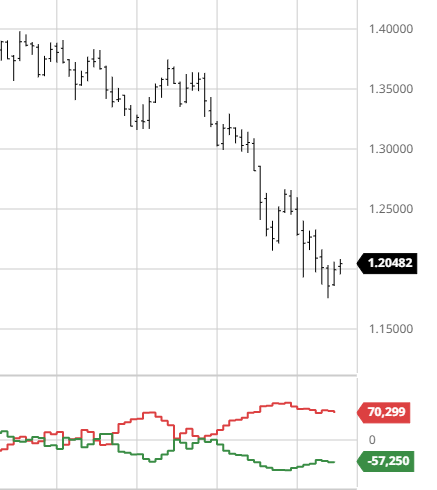


I built this chart to know when the percentages are close to the edges of 0% to 100% indicating a change in trend.
Does anyone else study cot like this? I want to learn how to use cot, I’m here to learn too.