GBP/USD Technical Analysis Summary
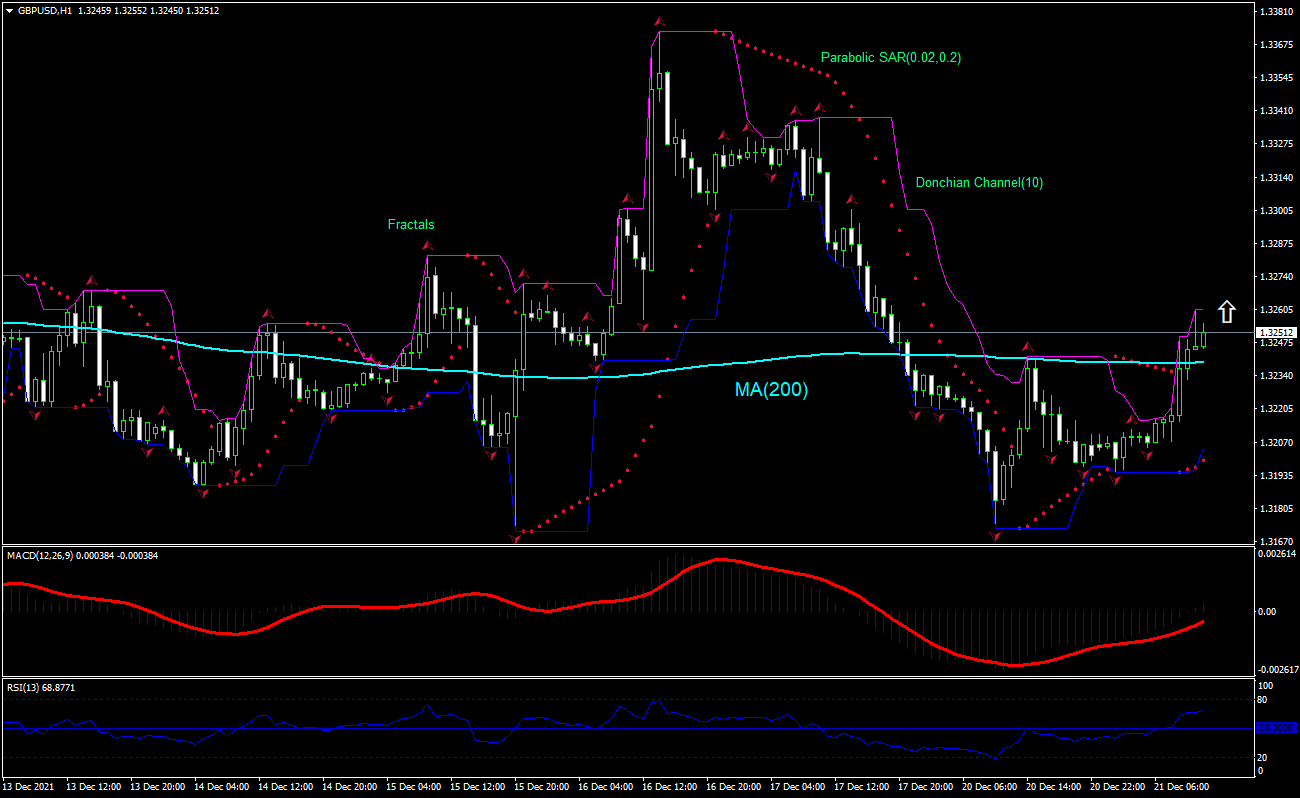
Buy Stop:Above 1.3261
Stop Loss:Below 1.3205
| Indicator | Signal |
|---|---|
| RSI | Neutral |
| MACD | Buy |
| Donchian Channel | Buy |
| MA(200) | Buy |
| Fractals | Buy |
| Parabolic SAR | Buy |
GBP/USD Chart Analysis
GBP/USD Technical Analysis
The technical analysis of the GBPUSD price chart on 1-hour timeframe shows GBPUSD,H1 has breached above the 200-period moving average MA(200) which is level. We believe the bullish movement will continue after the price breaches above the upper bound of the Donchian channel at 1.3261. A level above this can be used as an entry point for placing a pending order to buy. The stop loss can be placed below 1.3205. After placing the order, the stop loss is to be moved to the next fractal low indicator, following Parabolic signals. Thus, we are changing the expected profit/loss ratio to the breakeven point. If the price meets the stop loss level without reaching the order, we recommend cancelling the order: the market has undergone internal changes which were not taken into account.
Fundamental Analysis of Forex - GBP/USD
UK’s Confederation of British Industry survey results were worse than expected for December. Will the GBPUSD price rebound persist?
UK’s Confederation of British Industry survey results were worse than expected for December: the CBI Distributive Trades Survey showed UK Retail sales growth slowed sharply in the year to December. The CBI Realized Sales index fell to 8 for December from 39 in November, when a fall to 24 was forecast. This is bearish for GBPUSD. However current technical setup is bullish for the pair.