GBPAUD Technical Analysis April 2/2019
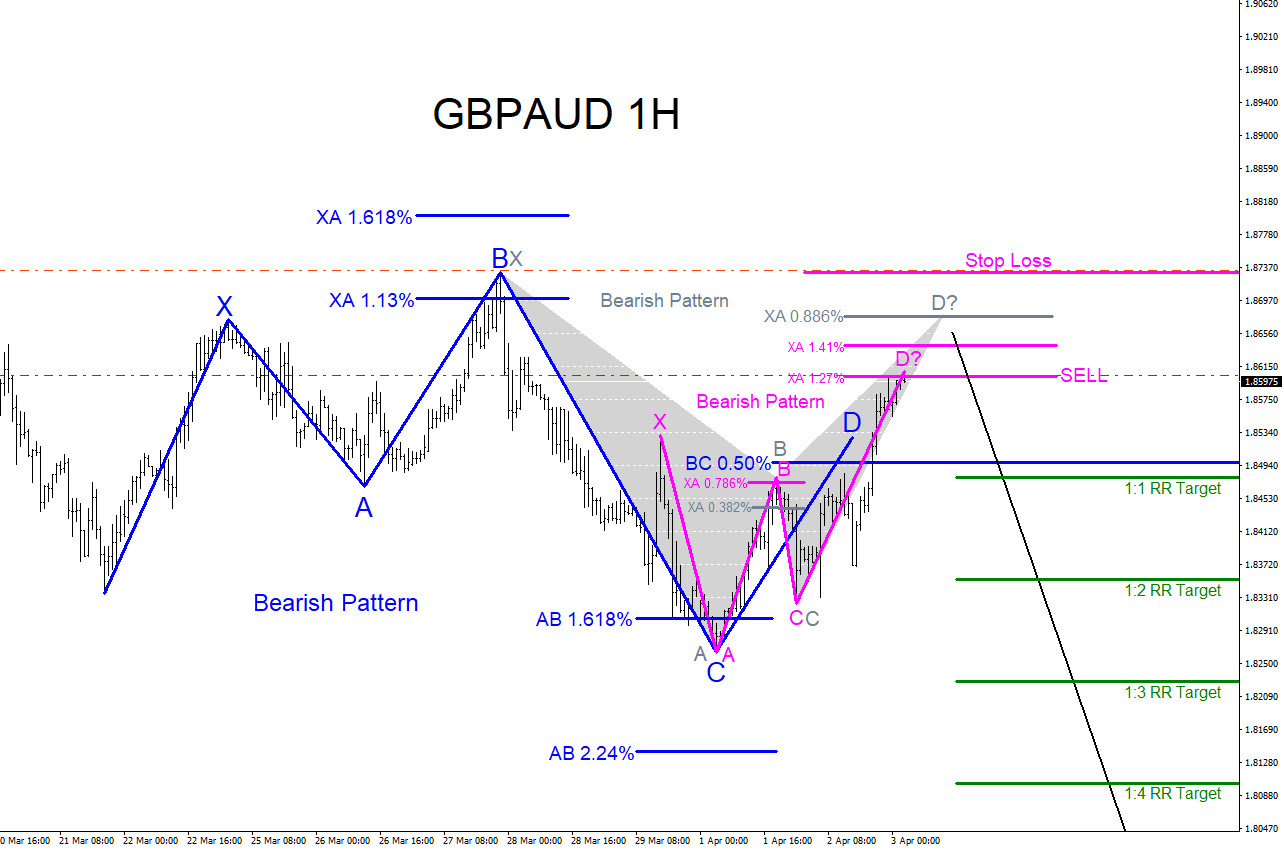
GBPAUD : Bearish market patterns can be seen on the GBPAUD 1 hour chart. In the chart below both the blue and pink bearish patterns already triggered SELLS. Blue bearish pattern triggered SELLS at the BC 0.50% Fib. retracement level and the pink bearish pattern triggered SELLS at the XA 1.27% Fib. retracement level. Only the grey bearish pattern has still not triggered SELLS (XA 0.886%). Price does not need to move higher to the grey XA 0.886% Fib. level to trigger the grey bearish pattern SELL for the pair to start a move lower. Both blue and pink bearish patterns have already got sellers in the market. If looking to trade GBPAUD stops should be placed at the point B high of the blue bearish pattern and traders should watch for a possible move lower at the pink XA 1.27% Fib. level. The targets (green) are based on the pink bearish pattern XA 1.27% entry. As long as the March 27/2019 high holds GBPAUD has a strong probability of making another move lower. Only time will tell what GBPAUD will do but at least now you are aware of the possible area where the pair can reverse lower from.
GBPAUD 1 Hour Chart 4.2.2019
Of course, like any strategy/technique, there will be times when the strategy/technique fails so proper money/risk management should always be used on every trade. Hope you enjoyed this article.