GBPJPY Technical Analysis April 10/2019
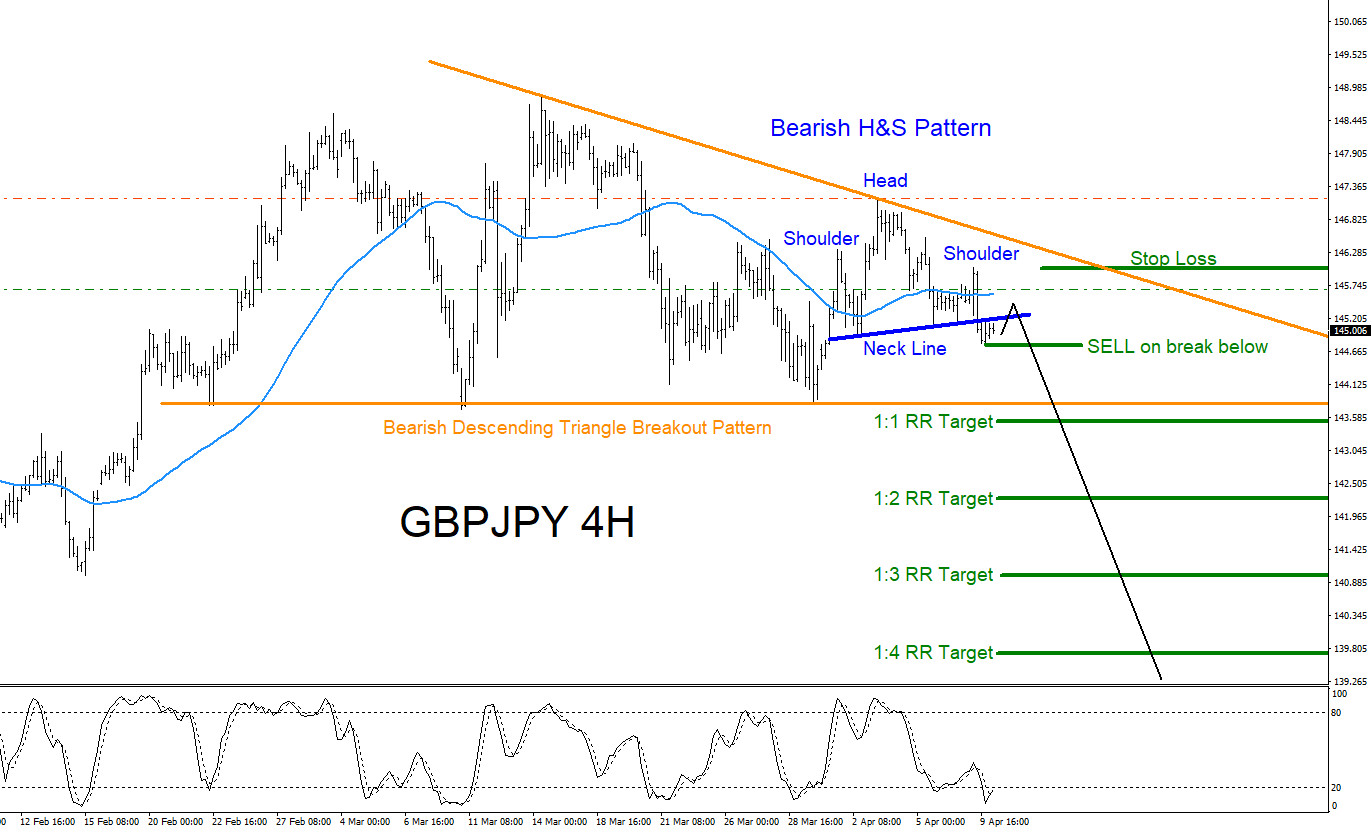
GBPJPY : Bearish market patterns can be seen on the GBPJPY 4 hour chart. In the chart below a blue bearish Head and Shoulders pattern is visible and price has already broken below the Neck Line which can be signalling for more possible downside in the coming trading sessions. As long as the right shoulder of the H&S pattern remains intact it is highly possible that GBPJPY will continue lower. A break above the high of the right shoulder will invalidate the blue bearish pattern. If price stays below the high of the right shoulder and pushes lower traders will then need to watch for the break below the orange descending triangle pattern. A break below the orange triangle pattern will confirm that sellers are in control and price will continue lower and hit the targets below. Another added confirmation will be if price respects the light blue 50 moving average before the sell entry breakout. Price respecting the moving average before the sell breakout entry will signal that possible trend to the downside is still going on which started from the March 14/2019 high. If looking to trade GBPJPY traders will need to watch if price stays below the April 9/2019 high and SELL on the break below the April 9/2019 low (green sell entry). If this happens then stops should be placed at the high of the right shoulder (April 9/2019 high). If price breaks above top of right shoulder before the green SELL break entry then the sell trade setup is cancelled. There is UK news release coming later today at 4:30am EST so trade safe and only SELL GBPJPY if the patterns stay intact.
GBPJPY 4 Hour Chart 4.10.2019
Of course, like any strategy/technique, there will be times when the strategy/technique fails so proper money/risk management should always be used on every trade.