GBPNZD Technical Analysis January 8/2019
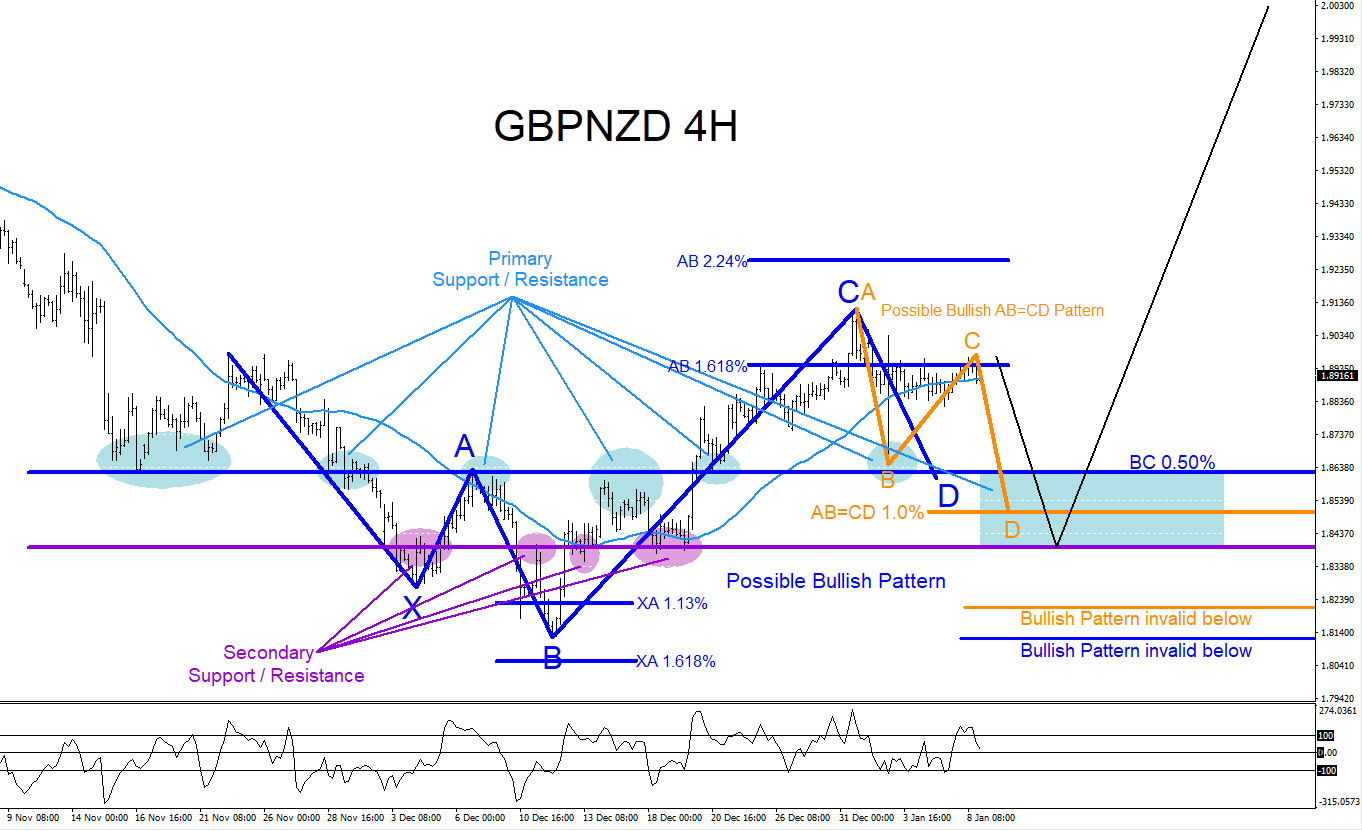
Bullish market patterns can be seen on the GBPNZD 4 hour chart. In the chart below there are possible bullish patterns that can trigger BUYS if the market makes another move lower. The green bullish AB=CD pattern triggers BUYS at the Fib. extension 1.0% level and the blue bullish pattern triggers BUYS at the BC 0.50% Fib. retracement level. Traders should watch these levels for a possible reaction bounce higher because there has been previous support/resistance price action in the past. First support/resistance level can be seen at the blue trend line where the blue bullish pattern triggers BUYS at the BC 0.50% Fib. retracement level. GBPNZD can also dip lower towards the purple second support/resistance level where we could expect more buyers waiting to push the pair higher. Traders will need to wait and watch if the pair makes another dip lower and also see how price reacts at the possible support zone (blue box) where GBPNZD bulls will be waiting. If looking to trade GBPNZD stops should be placed at the point B low of the blue bullish pattern looking for a rally higher to extend above the December 31/2018 highs. Only time will tell what GBPNZD will do but at least now you are aware of the possible area where the pair can bounce from.
GBPNZD 4 Hour Chart 1.8.2019
Of course, like any strategy/technique, there will be times when the strategy/technique fails so proper money/risk management should always be used on every trade. Hope you enjoyed this article.
*** Always use proper risk/money management according to your account size ***