Firstly, the GDX ETF was created in 2006. From there it bounced higher into the September 2011 highs. This not shown on the chart however the price trend was obviously up. The pullback lower into the January 2016 lows corrected the cycle from the all time highs. The bounce from the January 2016 lows was strong enough to suggest it was no longer pulling back lower. It ended that bullish cycle August 2016. I give Elliott Wave benefit of the doubt that was a lead diagonal up. The January 2016 low should hold in any further dip.
Secondly. Where I think that will happen is highlighted on the chart below. Before getting to that point again later I would like to talk about the cycle lower from the August 2016 high that suggests that area holds. Notice on the chart it has red 1, 2 and 3. The red 1 marked the end of a cycle in December 2016 and the red 2 marked the end of a three swing correction of that cycle.
The area on the chart that is highlighted is measured with a Fibonacci extension tool. Begin at the August 2016 high as point 1. Go down from there to the December 2016 lows as point 2. Then back up to the February 2017 highs as the point 3. This will give the extension area highlighted on the chart. The analysis and conclusion continues below the chart.
$GDX Weekly Chart
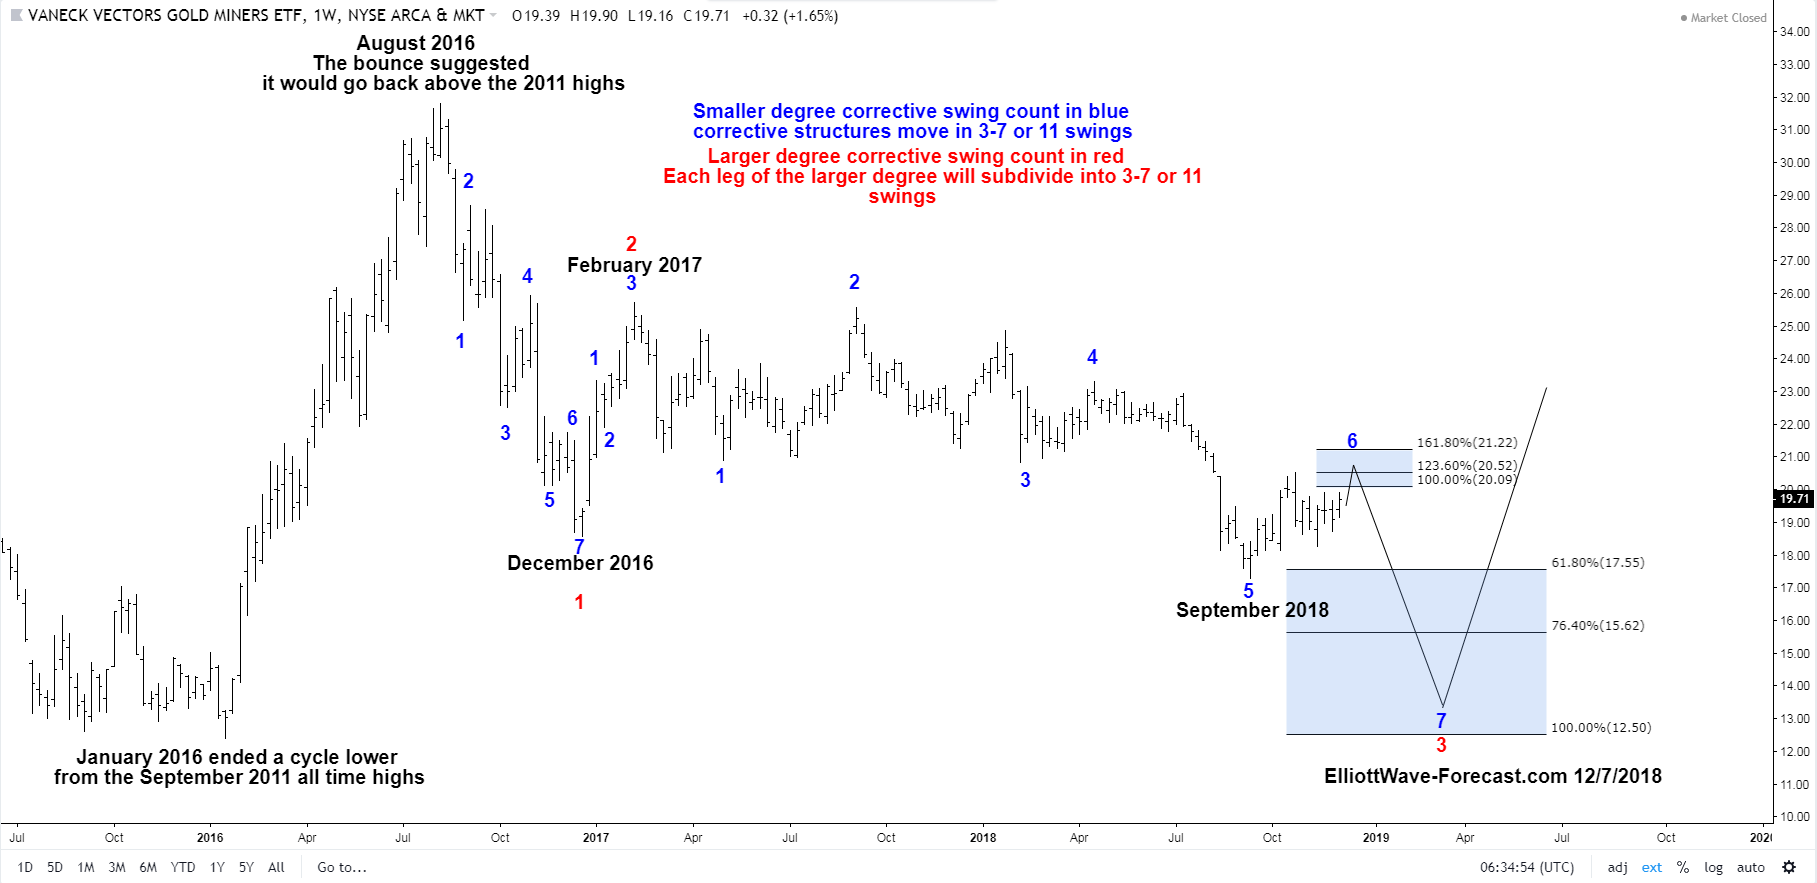
In conclusion and as previously mentioned the bounce from the January 2016 lows ended a larger cycle lower. It favored an impulse more than anything however was strong enough to suggest it would go back above the 2011 highs eventually. This leads to the belief the January 2016 lows at 1240 will remain intact during what appears to be a corrective sequence pullback. You will notice the 100% equal legs line in the highlighted area is at 1250. These areas are typically seen in double three corrections. As of now I tend to favor seeing the last swing end in between there and the 15.62 extension.
Thanks for looking.
Kind regards & good luck trading.
Lewis Jones of the ElliottWave-Forecast Team