In this technical blog, we will take a look at the past performance of 1 Hour Elliott wave chart of General Electric aka GE presented at elliottwave-forecast.com. In which, the stock showed a lower low sequence from January earlier this year’s peak therefore we expected more downside in GE to take place. So we advised members not to buy it at this stage & bounces should get fail in 3 or 7 swings. We will explain the forecast below:
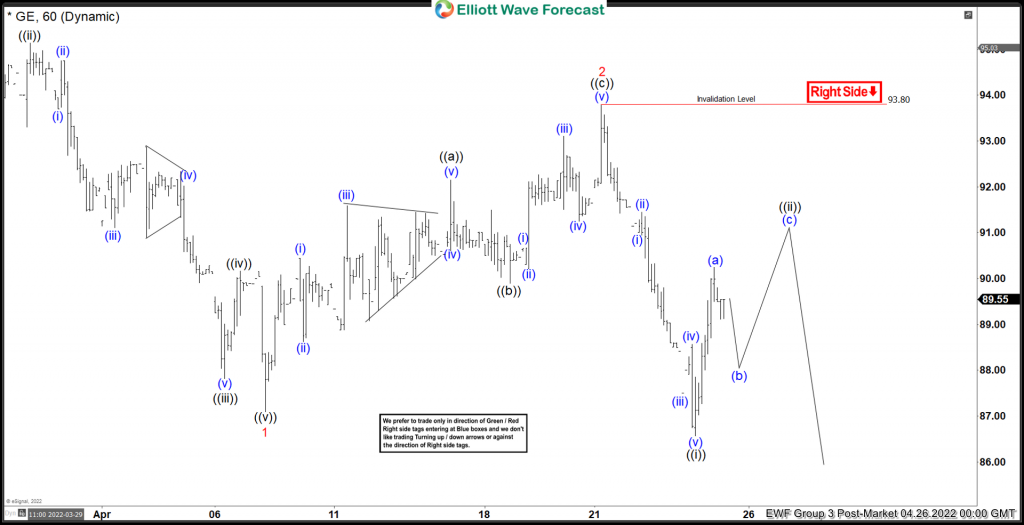
GE 1 Hour Elliott Wave Chart
Above is the 1 Hour Elliott wave chart from 4/28/2022 Post-Market update ahead of the earnings reports. In which, the bounce to $93.80 high ended wave 2 of a bigger correction. Down from there, the stock failed in an impulse structure & ended lesser degree wave ((i)) at $86.58 low. Up from there, the stock made a 3 wave bounce higher in wave ((ii)) to correct the short-term cycle from the 4/21/2022 high before more downside can be seen.
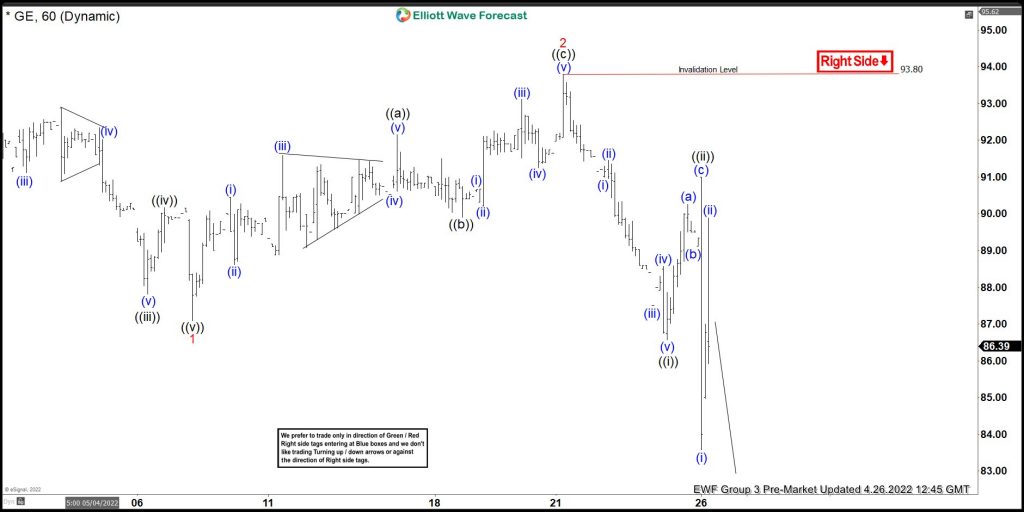
GE Latest 1 Hour Elliott Wave Chart
This is the Latest 1 Hour Elliott wave chart from the Pre-Market update. Showing stock failing lower after the earnings reports as we expected. Since the reports, the stock has already made new lows below March lows confirming the next extension lower towards $69.16 target area lower.
Source: GE (General Electric) Got Rejected On Earning Reports

