Hello everyone. In today’s article, we will look at the past performance of the 1 Hour Elliott Wave chart of General Electric Co. ($GE) The rally from 6.23.2023 low unfolded as a 5 wave impulse with an incomplete bullish sequence from 7.19.2023 low. We will explain the structure & forecast below:
$GE 1H Elliott Wave Chart 8.01.2023:
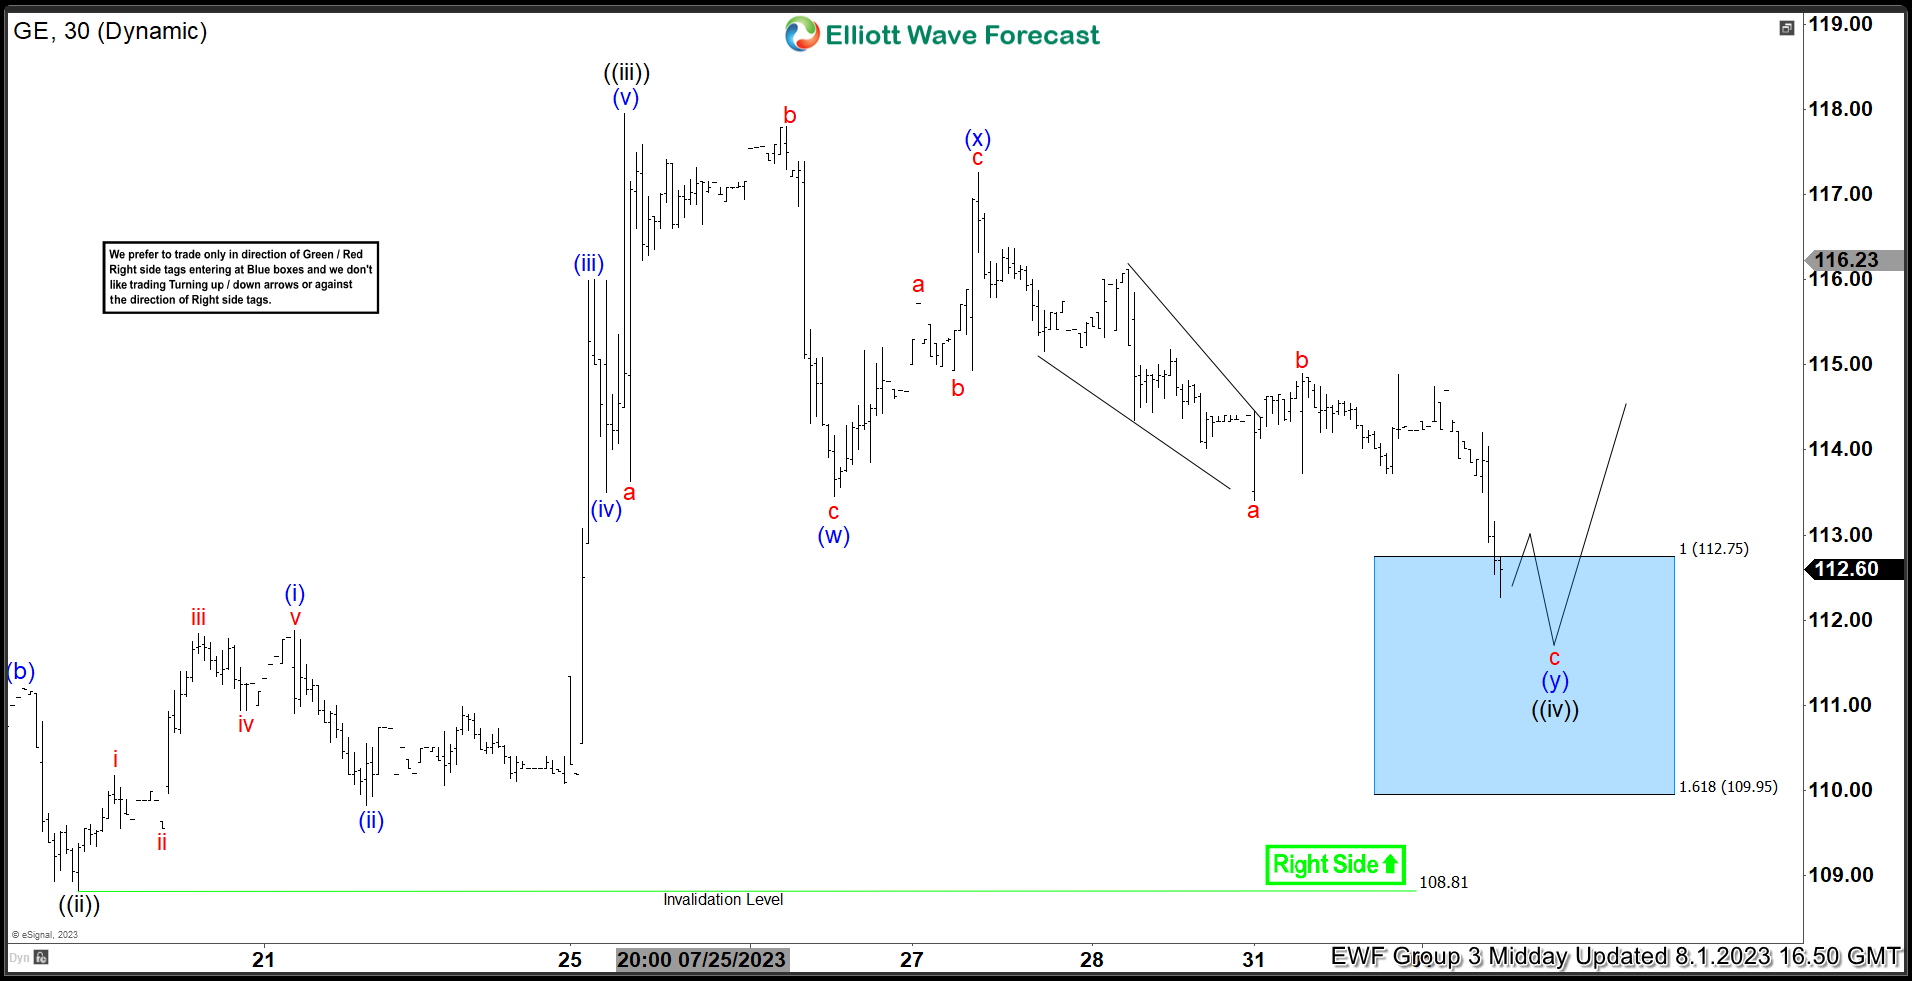 Here is the 1H Elliott Wave count from 8.01.2023. The rally from 7.19.2023 at black ((ii)) unfolded in a 5 wave impulse which signaled a bullish trend. We expected the pullback to find buyers in 7 swings at $112.75 – 109.95.
$GE Latest 1H Elliott Wave Chart 8.08.2023:
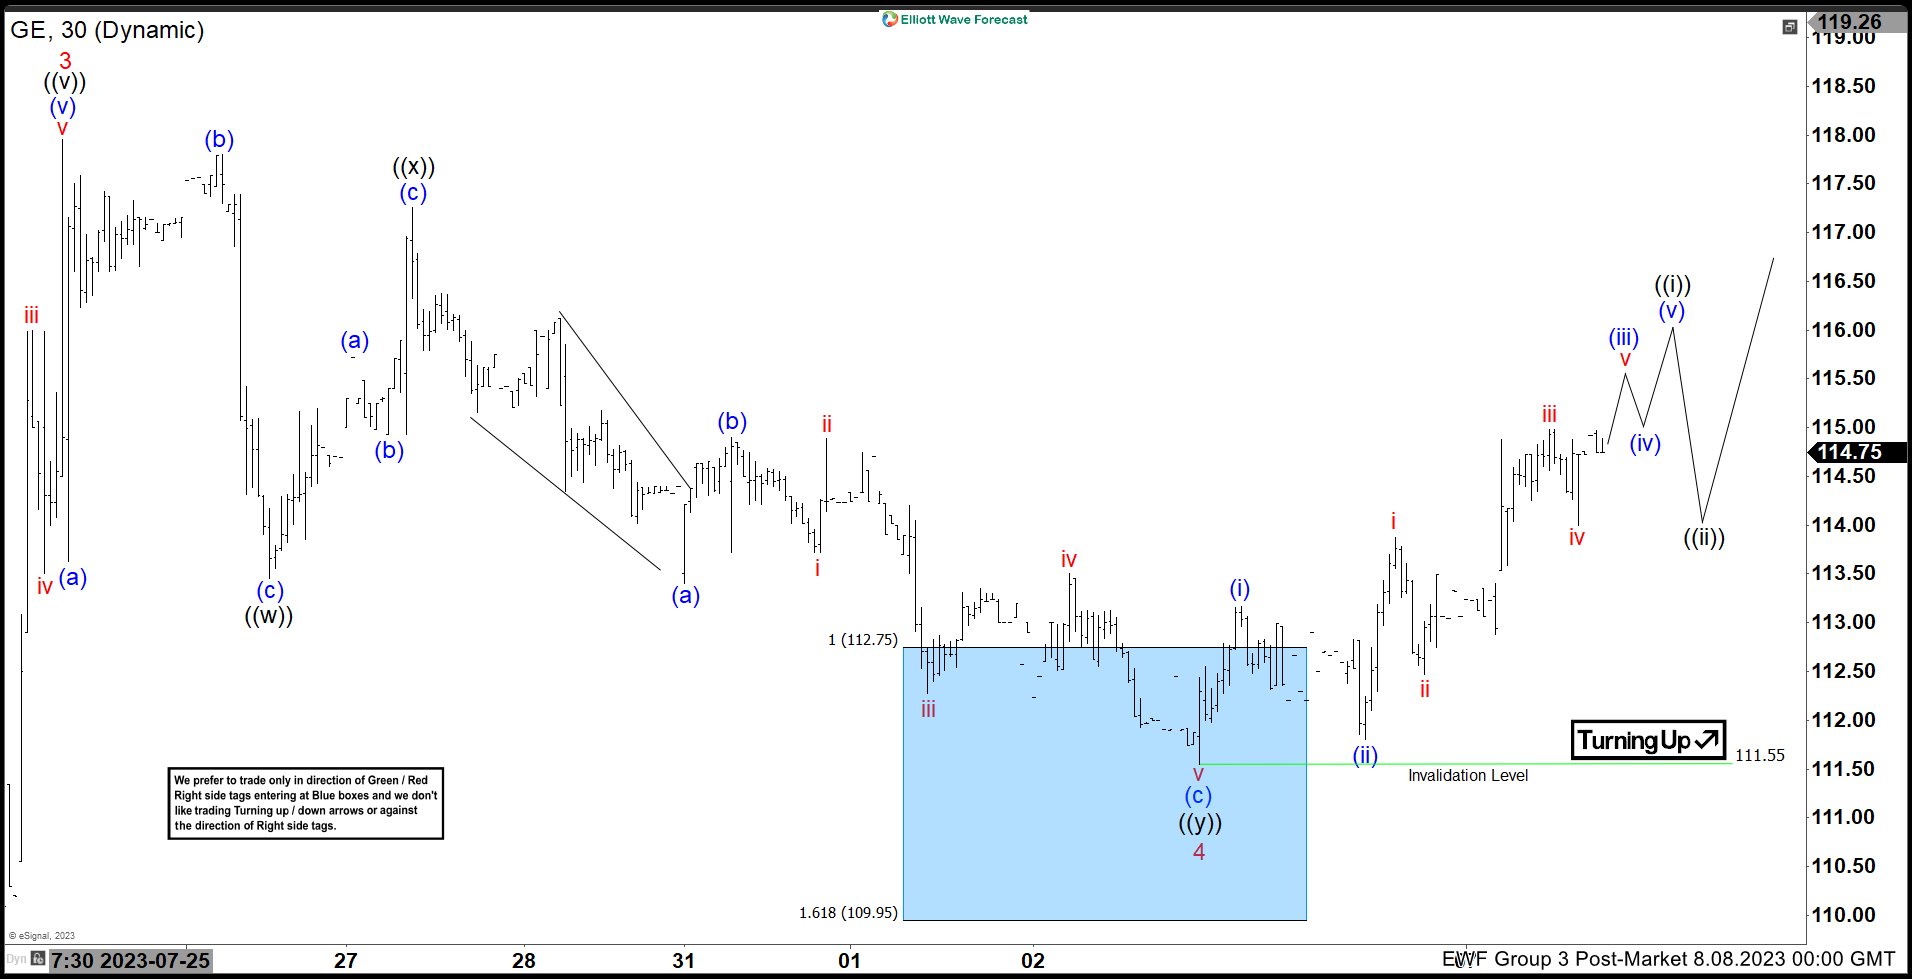 Here is the latest 1H update from 8.08.2023 showing the move taking place as expected. The pullback can become 11 swings where we will like to buy it again should that happen. Near term, we like it higher towards a new high for the year towards $119 before another pullback can happen.