Glencore plc is a British commodity trading and mining company. Marc Rich has founded the company 1974 which has its headquarters in Baar, Switzerland. Traded under tickers $GLEN at LSE and $GLNCY in US in form of ADRs, it is a component of the FTSE100 index. Glencore plc dominates the copper and zinc trading markets. Therefore, an investment in company shares can provide an exposure to the spot market prices of those metals. Besides that, company has crude oil, natural gas, coal and agriculture production facilities. After years of the prices depression in commodities, copper, crude oil and silver are already turning higher. As a consequence, natural gas and agricultural products may follow. Such a turn, without any doubt, will deliver a positive effect to the shareholders of mining and trading companies. Hereby, Glencore plc as a market leader should not become an exception.
Glencore Weekly Elliott Wave Analysis 06.27.2020
The weekly chart below shows the Glencore ADRs $GLNCY in the US. From the January 2016 lows at 1.938, the stock price has developed a cycle higher in wave I. Glencore has printed a top on January 2018 at 11.684. The cycle up is an impulse; blue wave (3) of black wave ((3)) shows a clear extension in price.
From the highs at 11.684, a correction lower has unfolded as a double three correction being a 3-3-3 structure. Black wave ((W)) is, hereby, a zigzag, ((X)) became an expanded flat structure, wave ((Y)) is another double three pattern of lower degree. The wave ((Y)) has reached an equality in length with the wave ((W)) at 3.952. As a consequence, price shows a reaction higher from the equal legs extension area 3.952-1.938. Since the $GLNCY price has broken the trendline higher, wave II showing 7 swings lower is preferred ended on March 2020 at 2.508. While above, Glencore can extend higher in wave III towards 11.684 and higher or do a 3 waves bounce at least.

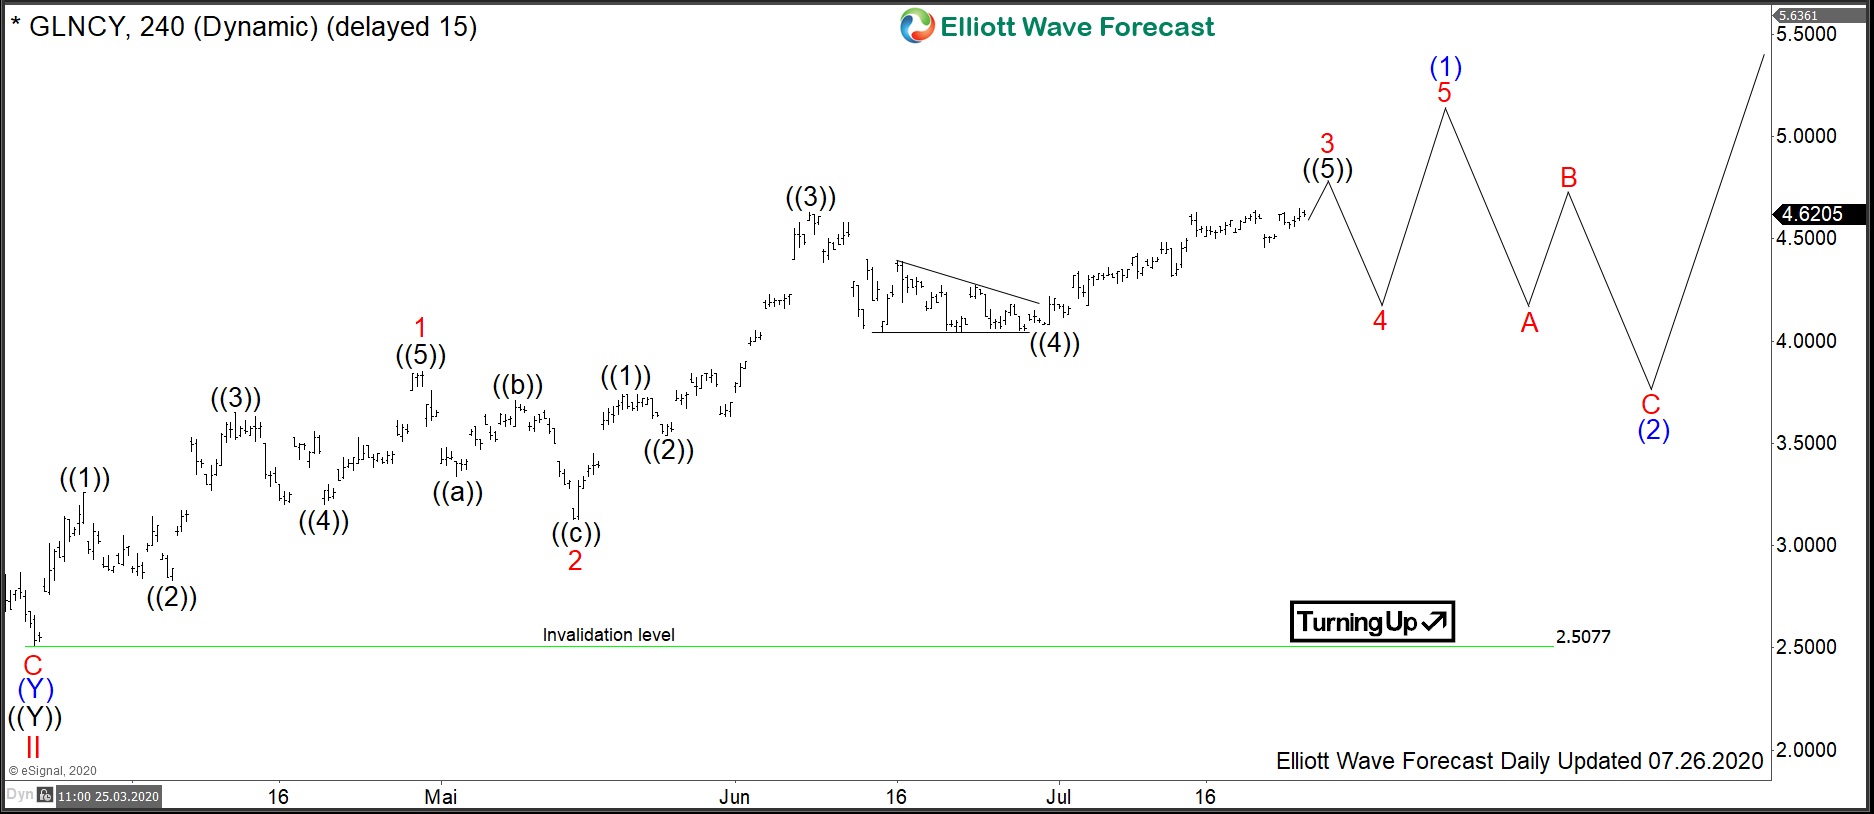
Glencore 4H Elliott Wave Analysis 07.26.2020
The 4H chart below shows in more detail the advance higher from the March lows at 2.508. The cycle up remains still intact and might be currently in the wave 3 of (1). After a pullback in wave 4, expect another push higher in wave 5 to end the march cycle. Medium-term, a correction lower in wave (2) should find support above the March lows in 3, 7 or 11 swings. Then, an extension higher in wave (3) to new highs should follow or $GLNCY should produce another leg higher at least.
In overall, weekly but also 4H view on $GLNCY shows a correlation with copper prices. The march cycle is similar also to that in silver, oil and indices. All these instruments may be turning up and are expected to see more upside. Therefore, Glencore can be a smart investment for those who want take an advantage of rising prises in both stocks and commodities.