Brazil, top exporter of Sugar, experiences record prices of ethanol as Covid-19 restrictions ease. Consumers take advantage of the easing and start travelling again, increasing consumption of biofuel. This means that mills can start processing more sugar cane into ethanol, rather than into sweetener as it’s also generally more profitable.
Severe droughts hitting Brazil has already created tight cane supplies. According to industry group Unica, cane crushing declined by 31% in the first half of April compared to last year. These two factors help sugar to extend the relentless rally. Futures prices in New York are already up 73% in the past 12 months. We are going to look at the technical chart of Sugar Futures (SB_F) using Elliott Wave below:
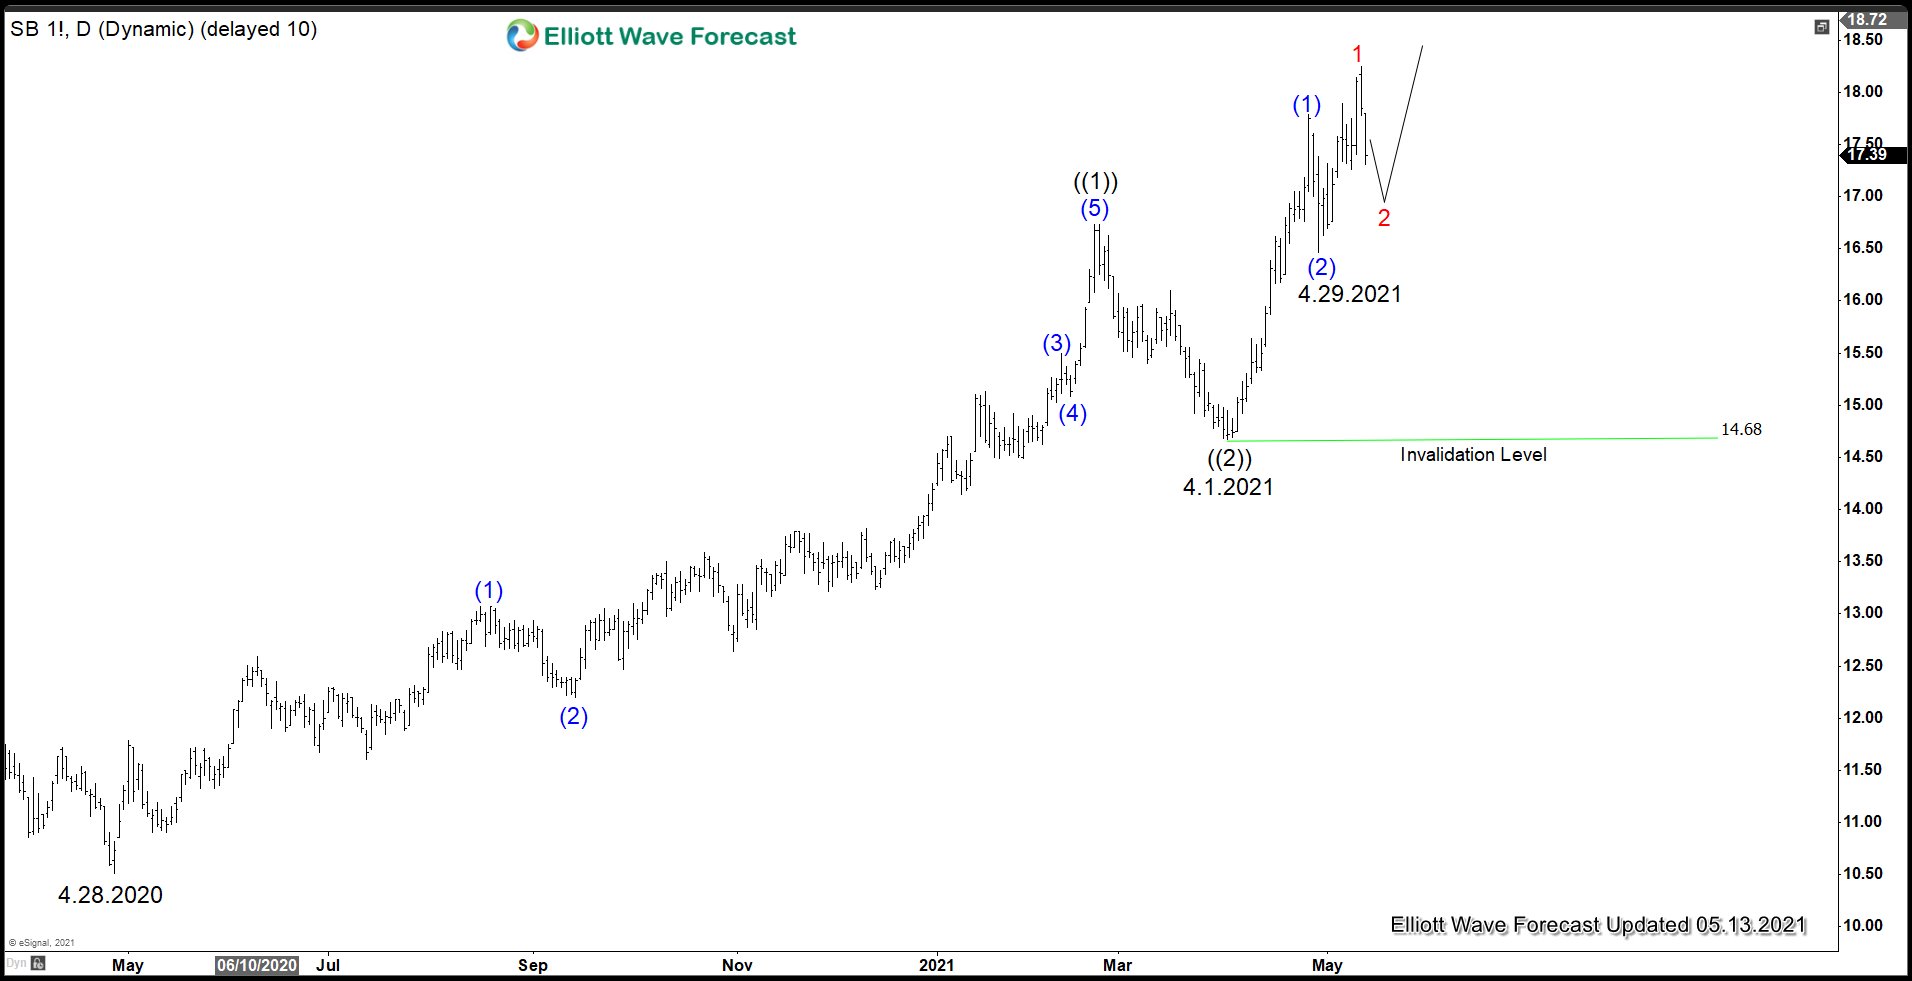
SB_F Daily Elliott Wave Chart
Since forming the low on April 28, 2020, SB_F has rallied relentlessly. The structure of the rally is an impulse and ended wave ((1)) at $16.73 then pullback in wave ((2)) also ended at $14.68 on April 1, 2021. From there, SB_F extends the rally and has broken above wave ((1)), suggesting wave ((3)) is currently in progress. Internal of wave ((3)) is also unfolding as another 5 waves of lesser degree. Up from wave ((2)), wave (1) ended at 17.79 and pullback in wave (2) ended at 16.46 on April 29, 2021. Near term, while pullback stays above wave (2) low at 16.46, and more importantly above wave ((2)) low at 14.68, SB_F should extend higher.
