Genmab A/S (GMAB) develops antibody therapeutics for the treatment of the cancer and other diseases. The company is based in Copenhagen, Denmark, comes under Healthcare – Biotechnology sector & trades as “GMAB” ticker at Nasdaq.
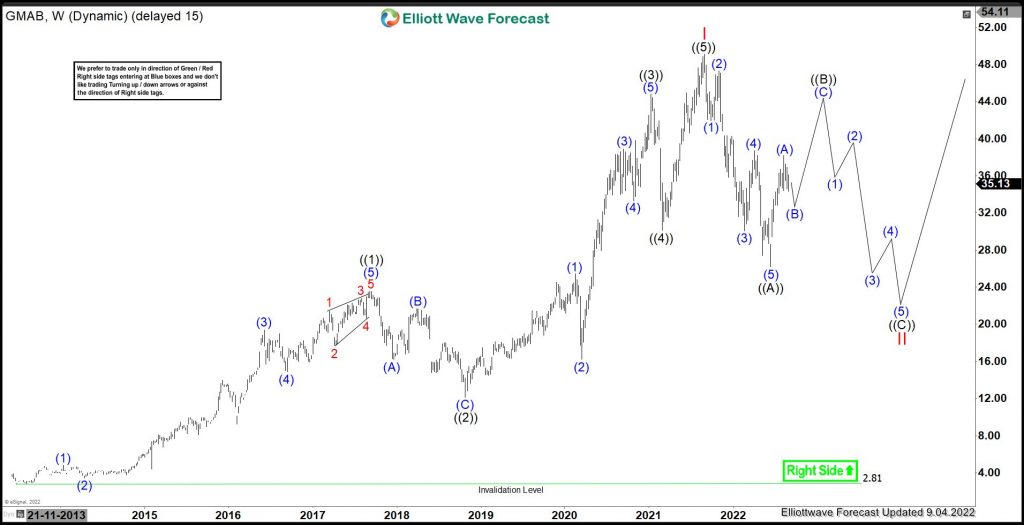
GMAB made an all time high at $49.07 & currently favors correcting lower the sequence up since 2013 low. It favors a corrective bounce as connector, which expect to fail below all time high to resume lower in proposed zigzag correction.
GMAB - Elliott Wave Latest Weekly Chart :
Since 2013, all time low of $2.80, it ended an impulse sequence at $49.07 high. It ended ((1)) at $23.55 high & placed ((2)) at $12.10 low as correction. Wave ((2)) was 0.5 Fibonacci retracement of ((1)). It placed ((3)) at $44.83 high as 1.618 Fibonacci extension of ((1)). It favored ended ((4)) at $30.10 low. Finally, it ended ((5)) at $49.07 high as wave I in the sequence started since 2013 low. Below there, it correcting lower in II in proposed zigzag structure.
Below wave I high, it placed ((A)) at $26.19 low. Above there, it favors higher in ((B)) connector, which ideally should fail below all time high to resume lower in ((C)) leg. Currently, it favors pullback in (B) leg before upside in (C) of ((B)). We like to buy the dips towards equal leg areas, when reached in ((C)) of II for at least 3 swing bounce or upside in wave III.
Source: GMAB : Should Expect Sideways To Lower Before Upside Resumes
