In this article, we are going to provide an update of XAUEUR chart. In the previous article from April 23, 2020, we stated that Gold against Euro dollar (XAUEUR) should continue to move higher. XAUEUR has broken to all-time high after it broke above the previous high on Oct 2012 at 1386.5. This is very significant as it creates a bullish sequence from all-time low and suggests the long term direction is higher. The breakout happened on September 2019 when it broke above 1381.5. It has pullback and retested the breakout level on Covid-19 news selloff. After forming the low at 1300.9, it has since rallied to new high again. Below is the weekly chart per April 23, 2020.
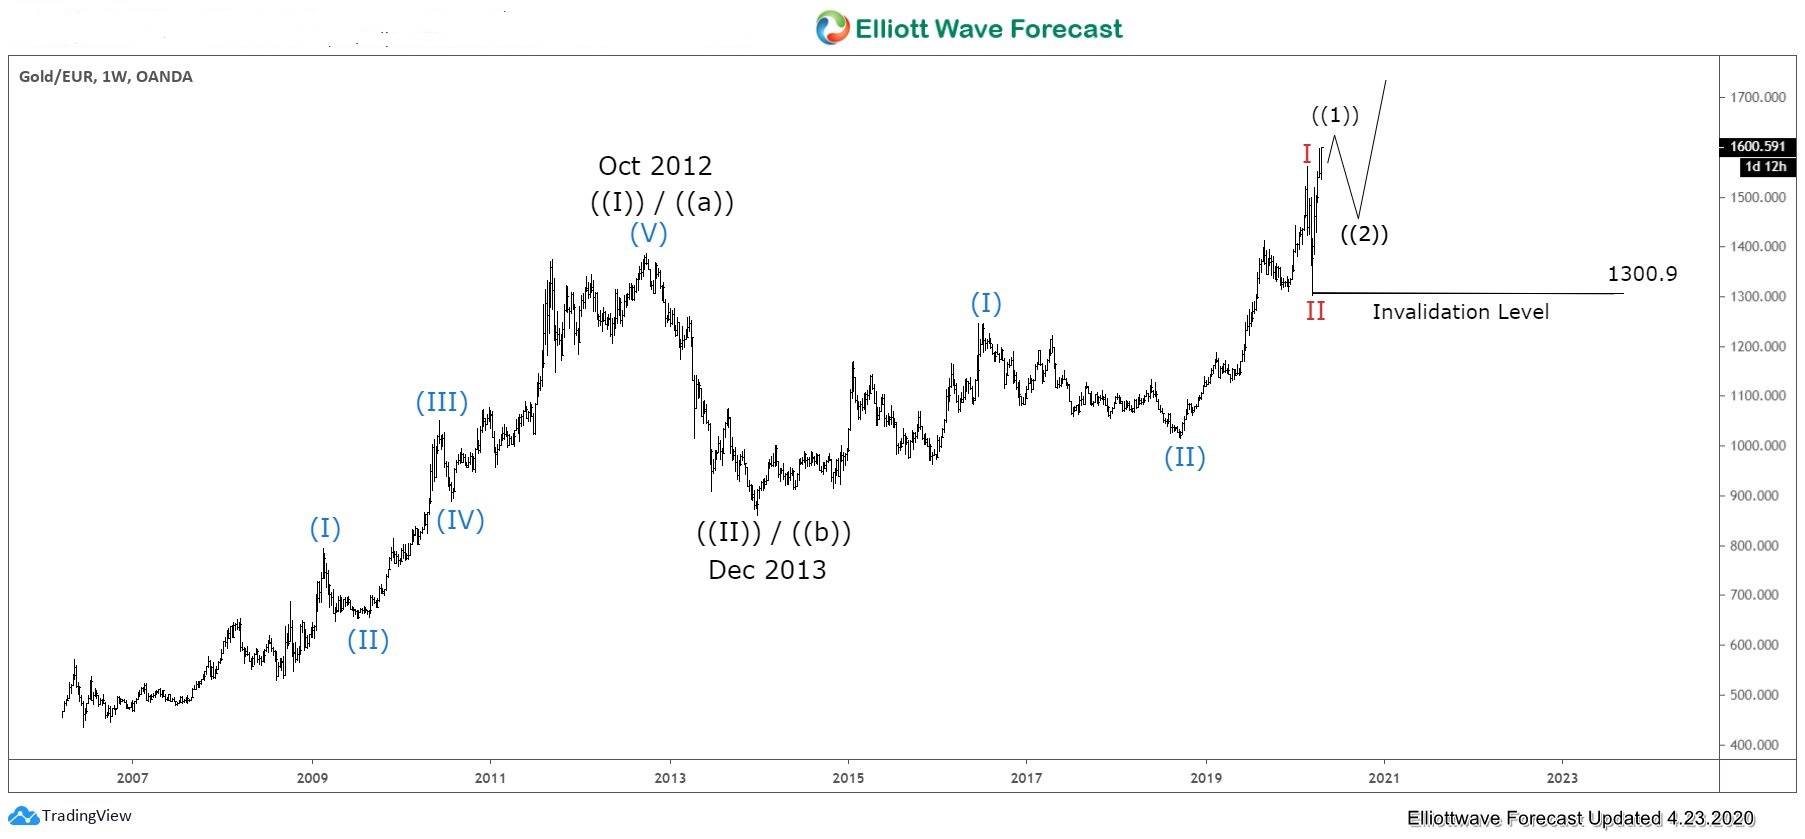
The Covid-19 selloff allows XAUEUR to retest previous all-time high on October 2012 at 1386. The pullback ended at 1301 on March 16 and this low is likely going to hold any subsequent pullback going forward.
XAUEUR Weekly Elliott Wave Chart 6.14.2020
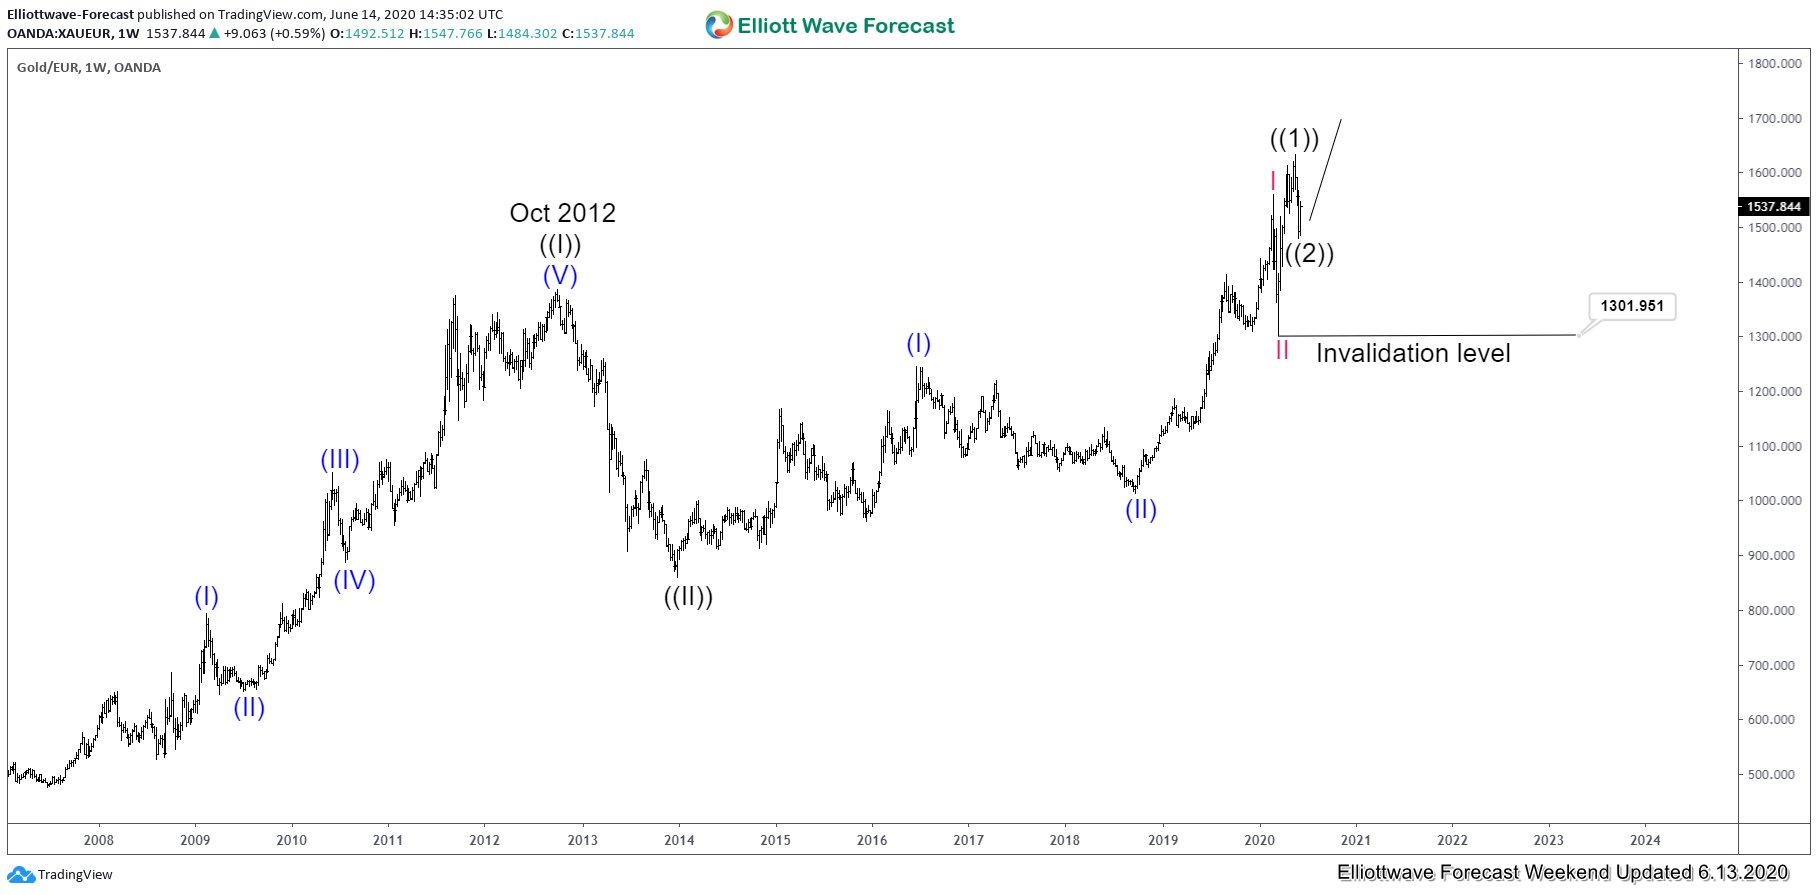
In the new updated weekly chart above, XAUEUR has ended wave ((1)) at 1633.08 and pullback in wave ((2)) has also ended at 1477.2.The instrument still needs to break above 1633.08 to avoid a double correction. If it breaks below 1477.2 low, then it’s doing a double correction and still expected to find support while above 1301 for more upside.
XAUEUR 4 Hour Elliott Wave Chart
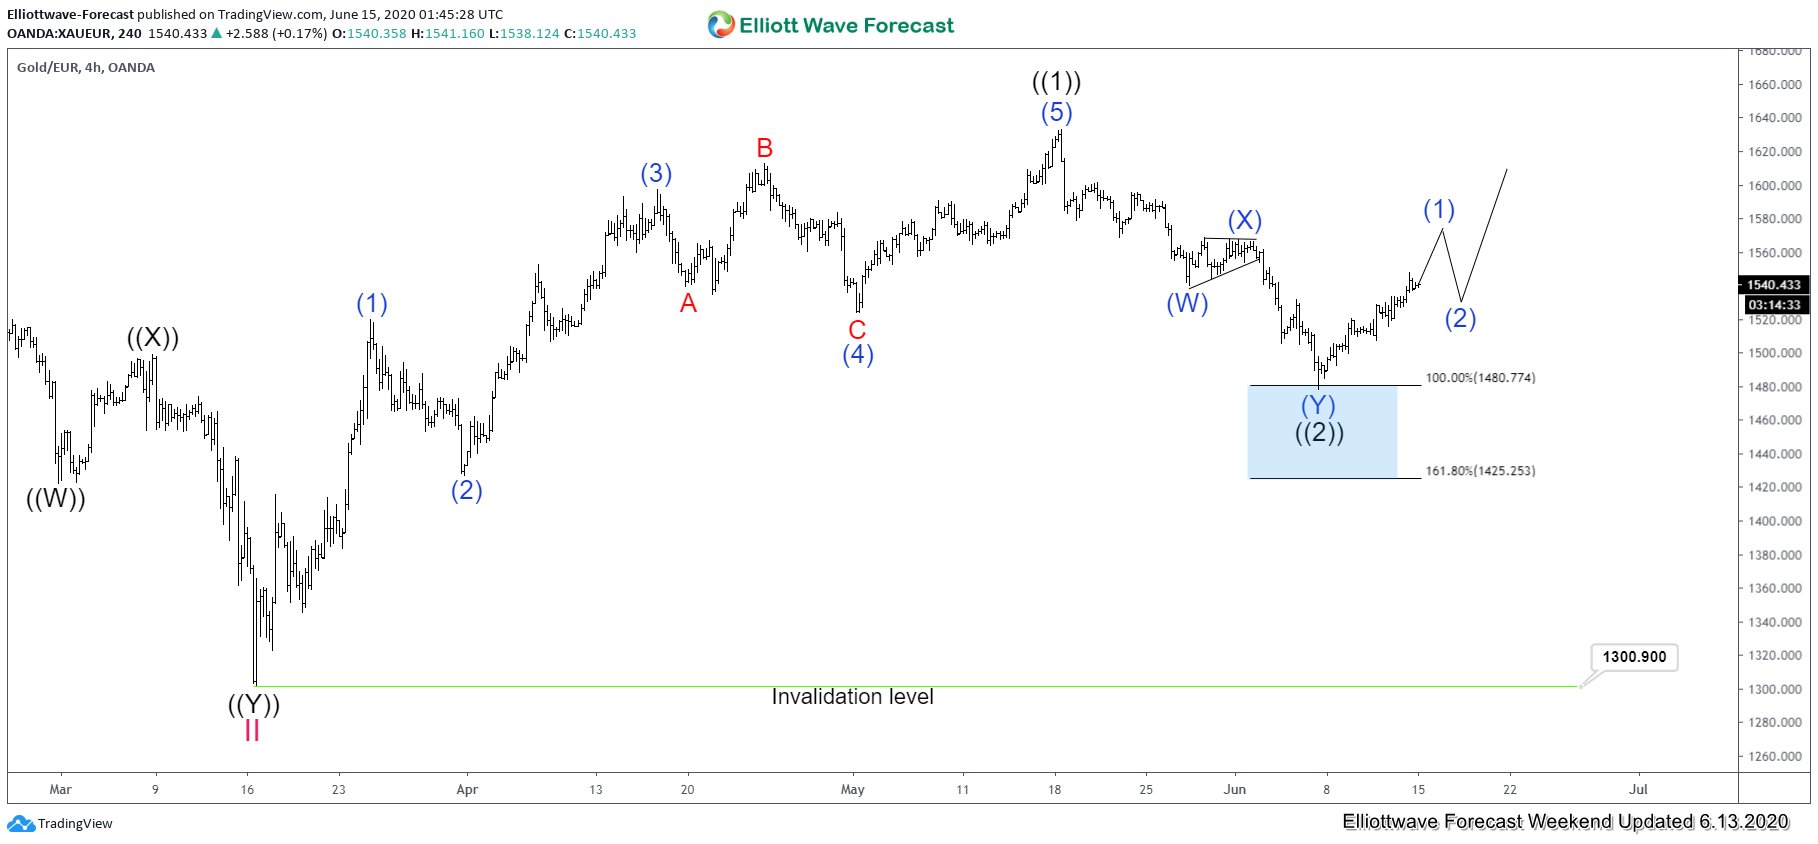
The 4 hour chart above shows that after ending wave II at 1300.9, the instrument has resumed the rally higher. Up from wave II, the rally unfolded as a 5 waves impulse Elliott Wave structure where wave (1) ended at 1519.59 and wave (2) ended at 1426.28. XAUEUR then resumes higher in wave (3) towards 1597.41, and dips in wave (4) ended at 1523.16. Final leg higher in wave (5) ended at 1633.08. This 5 waves move ended wave ((1)) in higher degree. Pullback in wave ((2)) hit 100% in 3 swing perfectly at 1477.2. Near term, while pullback stays above 1477.2, and more importantly above 1300.9, expect the instrument to extend higher.