Gold took full advantage of lower yields on Friday to accelerate into its record high, leaving the question as to whether it can break above this key milestone or present us with a desirable pullback first. The ASX 200 is also considering a break above its 200-day MA.
By :Matt Simpson, Market Analyst
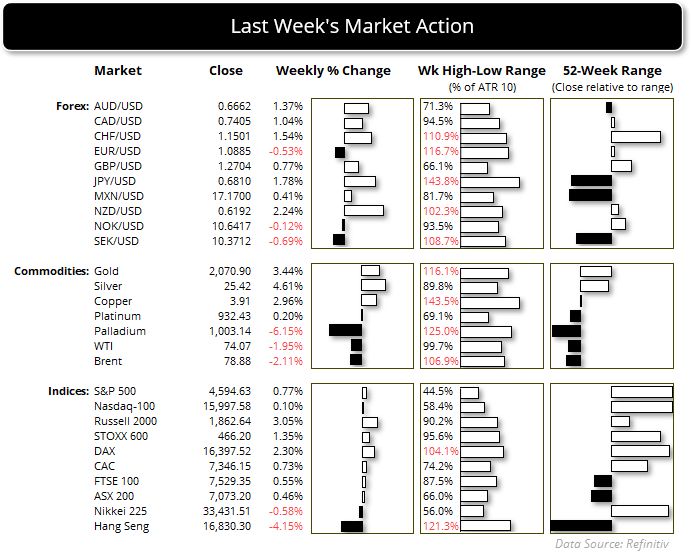
Market Summary:
- US bond yields continued to plunge on Friday, with the yield curve from the y-year and higher falling double digits in basis points terms. The 2-year fell nearly -40bp last week alone.
- ISM manufacturing contracted faster than expected, which was taken as another sigh that the US economy is slowing and the Fed need to cut in 2024.
- Wall Street rallied on Friday which saw the S&P 500 close just -1 points beneath its July high and the Dow Jones close back above 36k for the first time since January
- NZD and JPY were the strongest forex majors last week, thanks to the RBNZ’s hawkish statement and bets that the Fed will cut sooner than later which sent USD/JPY to an 11-week low
- Gold prices were on fire on Friday, which rose at their fastest daily pace in seven week, their best week in seven and posted its highest daily close on record. It now trades less than $10 from its record high set in April.
- Crude oil fell for a second consecutive day on Friday and fell for a sixth week, after it countertrend bounce stopped just shy of my $80 target before reversing. Traders were sceptical of the proposed OPEC cuts, as not all members are expected to comply and larger cuts may have been expected than the -2.2 million barrels per day presented. A move to $70 may not be on the cards unless OPEC come out swinging.
Events in focus (AEDT):
- 08:45 – New Zealand terms of trade
- 10:50 – BOJ monetary base y/y
- 11:00 – Australian inflation gauge (Westpac-Melbourne Institute)
- 11:30 – Australian job advertisements (ANZ), business inventories, company profits, home loans, RBA chart pack, retail sales (revised)
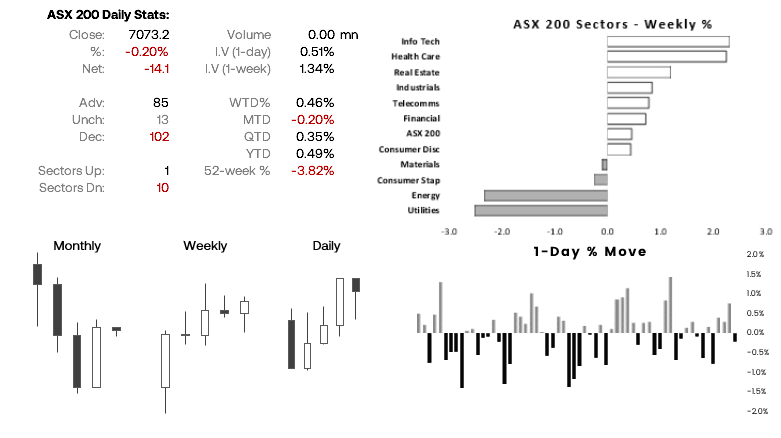
ASX 200 at a glance:
- The ASX 200 rose nearly 0.5% last week after finding support around 7,000
- 7 of its 11 sectors rose, led by info tech and healthcare
- Whilst a hanging man candle formed on the ASX cash market on Friday, the strong rally on Wall Street and SPI 200 futures after the official close point towards a strong open for the cash market today
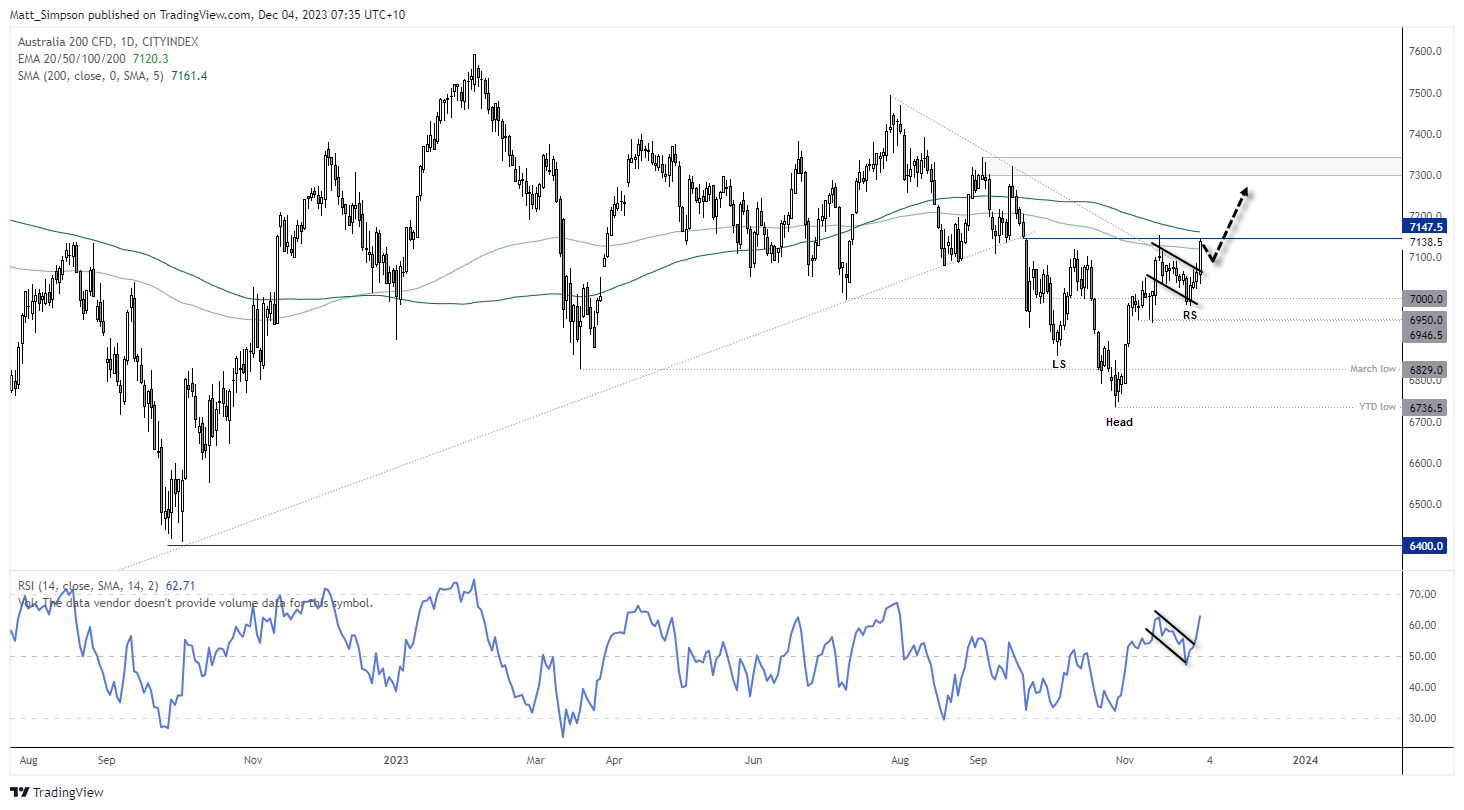
- The daily chart shows a potential inverted head and shoulders pattern, although personally I prefer to see such reversal patterns following an more established bearish trend (as this pattern accounts for nearly half of the entire decline)
- Still, the ASX saw a daily close above 7100 and the 200-day EMA on Friday and RSI (14) is confirming the rally higher
- However, 7138.5 resistance and the 200-day MA are looming, which may stimmy any early rally today – which has us on guard for at least a slight pullback
- But if bond yields continue to decline, it likely paints a bullish picture for APAC stocks and could see the ASX 200 break higher and head towards the highs around 7300
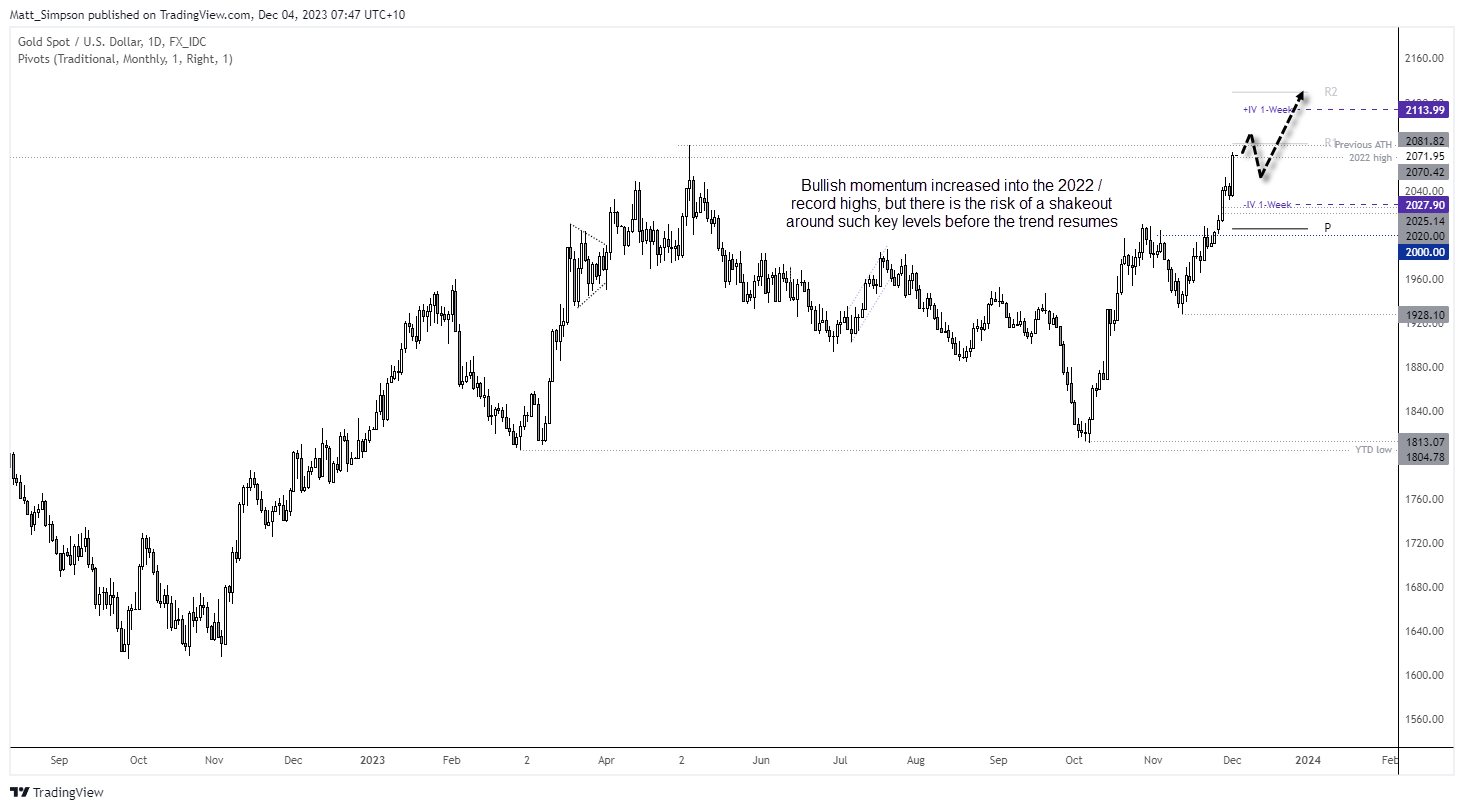
Gold technical analysis (daily chart):
I’ll admit to be a little taken back by the ferocity of gold’s rally, but with bonds continuing to drive sentiment and yields plunging, there seemed little place else for gold to go except up last week. Gold posted a solid rally on Friday into milestone highs, closing at a record high on the daily chart but just beneath the actual record high set in April. This makes it a bit of a tricky market to enter around current levels.
If bulls were to take a punt around current levels in anticipation of a breakout today or later this week, there is a real risk of a shakeout and reversal – simply due to the importance of these highs. A more cautious approach could include seeing if prices pull back and form a swing low at a more favourable price, or wait to see if any breakout above the ATH is then turned into support before reconsidering longs.
View the full economic calendar
– Written by Matt Simpson
From time to time, StoneX Financial Pty Ltd (“we”, “our”) website may contain links to other sites and/or resources provided by third parties. These links and/or resources are provided for your information only and we have no control over the contents of those materials, and in no way endorse their content. Any analysis, opinion, commentary or research-based material on our website is for information and educational purposes only and is not, in any circumstances, intended to be an offer, recommendation or solicitation to buy or sell. You should always seek independent advice as to your suitability to speculate in any related markets and your ability to assume the associated risks, if you are at all unsure. No representation or warranty is made, express or implied, that the materials on our website are complete or accurate. We are not under any obligation to update any such material.
As such, we (and/or our associated companies) will not be responsible or liable for any loss or damage incurred by you or any third party arising out of, or in connection with, any use of the information on our website (other than with regards to any duty or liability that we are unable to limit or exclude by law or under the applicable regulatory system) and any such liability is hereby expressly disclaimed.