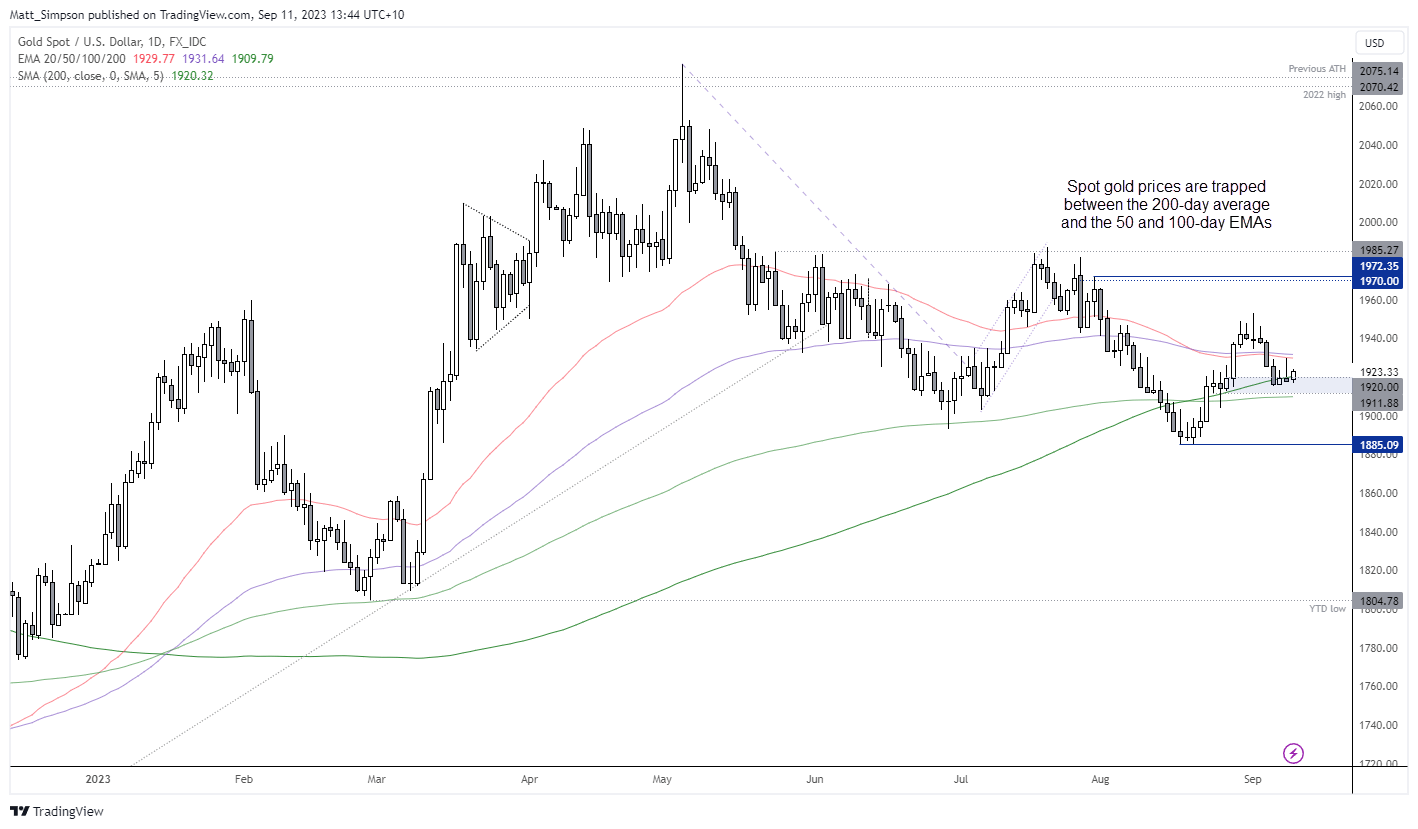
Gold technical analysis (daily chart):
Spot gold prices pulled back from the August high and fell just under 2, in line with my near-term bearish bias. Gold has since found support around its 200-day average, an important technical level which is not an easy one to crack. But we’re also seeing the US dollar pull back which is helping to support gold against the US dollar. Gold prices remain elevated against other forex majors which shows that XAU/USD has pulled back due to US dollar strength.
Yet it is debatable as to whether gold prices can truly rally from here, with a key US inflation report looming and the 50 and 100-day EMAs capping as resistance. With expectations for CPI to rise, the contrarian within me is wondering if US inflation will undershoot and weigh further on the US dollar, helping to support gold prices later in the week.
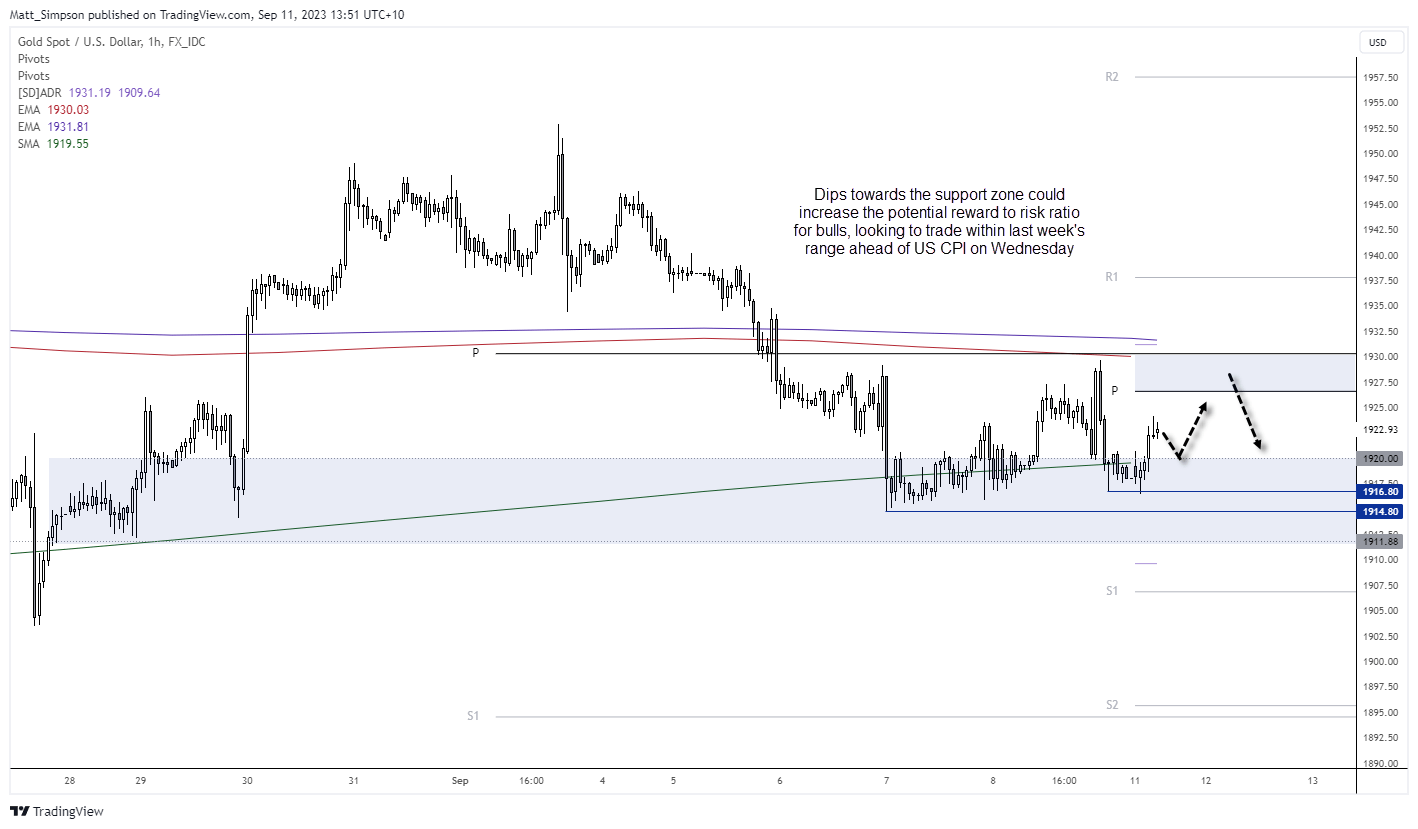
Gold technical analysis (1-hour chart):
The 1-hour chart shows that gold prices formed a higher low around the 200-day MA and have moved higher in today’s Asian session. With the weekly and monthly pivot points and 50/100-day EMAs overhead, bulls may want to only seek dips towards the support zone to increase the potential reward to risk ratio. Alternatively, bears may ant to fade into rallies that push gold into such resistance areas on the assumption that price action will remain choppy on the daily timeframe, heading into Wednesday’s US inflation report.