As September begins, we find ourselves in an interesting macro environment. Traders are weighing the likelihood of a recession against the prospect of “higher for longer” Fed rates.
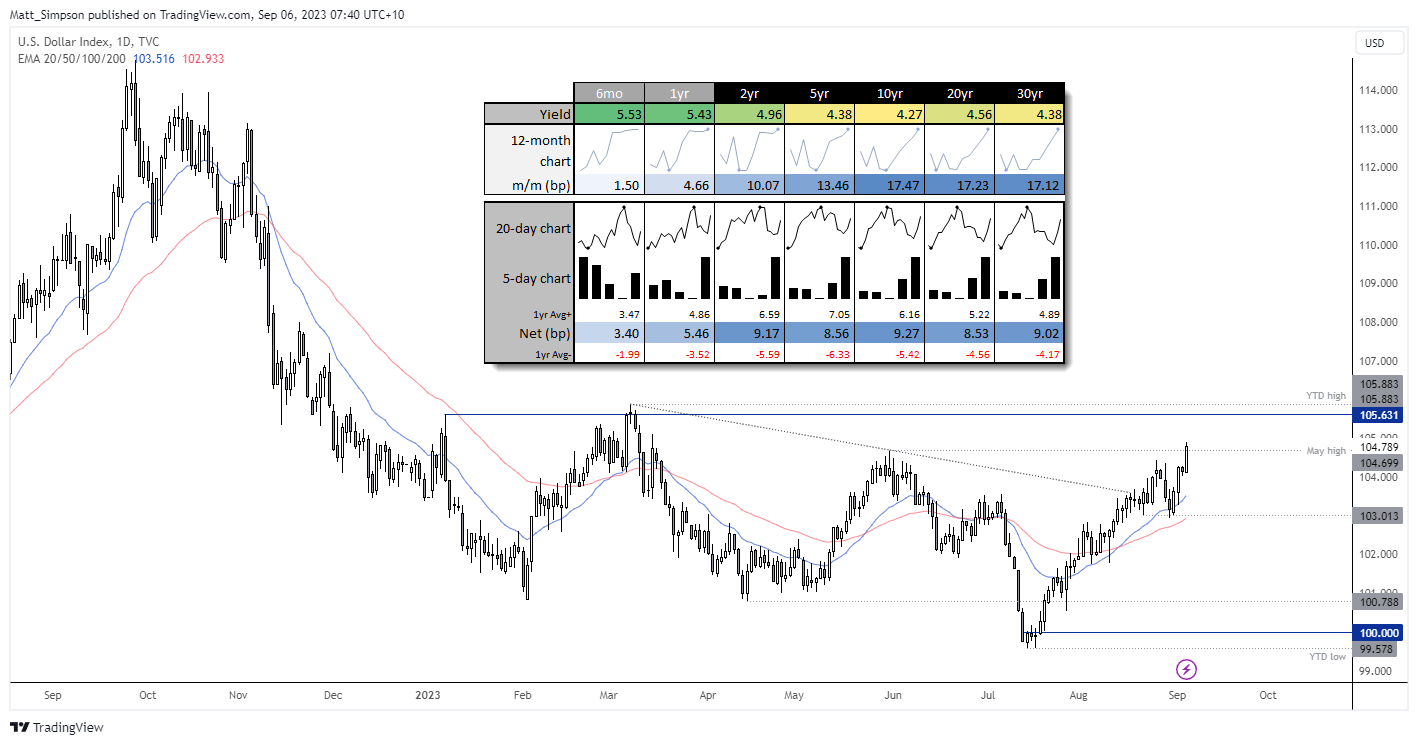
US bond yields have continued to surge this week, dragging the US dollar higher on concerns of a global slowdown. Softer employment data from the US, another round of weak PMI figures from China and Europe have seen the US dollar attract safe-haven flows, while bond investors demand a higher yield to compensate for the risk of a potential recession.
And thanks to the extended oil production cuts from Saudi Arabia and Russia, WTI crude oil is closing in on $90, renewing concerns about another round of inflation.
This sent the US dollar index to a 17-month high on Tuesday, and all US yields above 6 months continued higher. Yet while this weighed on gold prices, one could argue that it held up relatively well despite the dollar’s strength.
Is gold still a safe-haven?
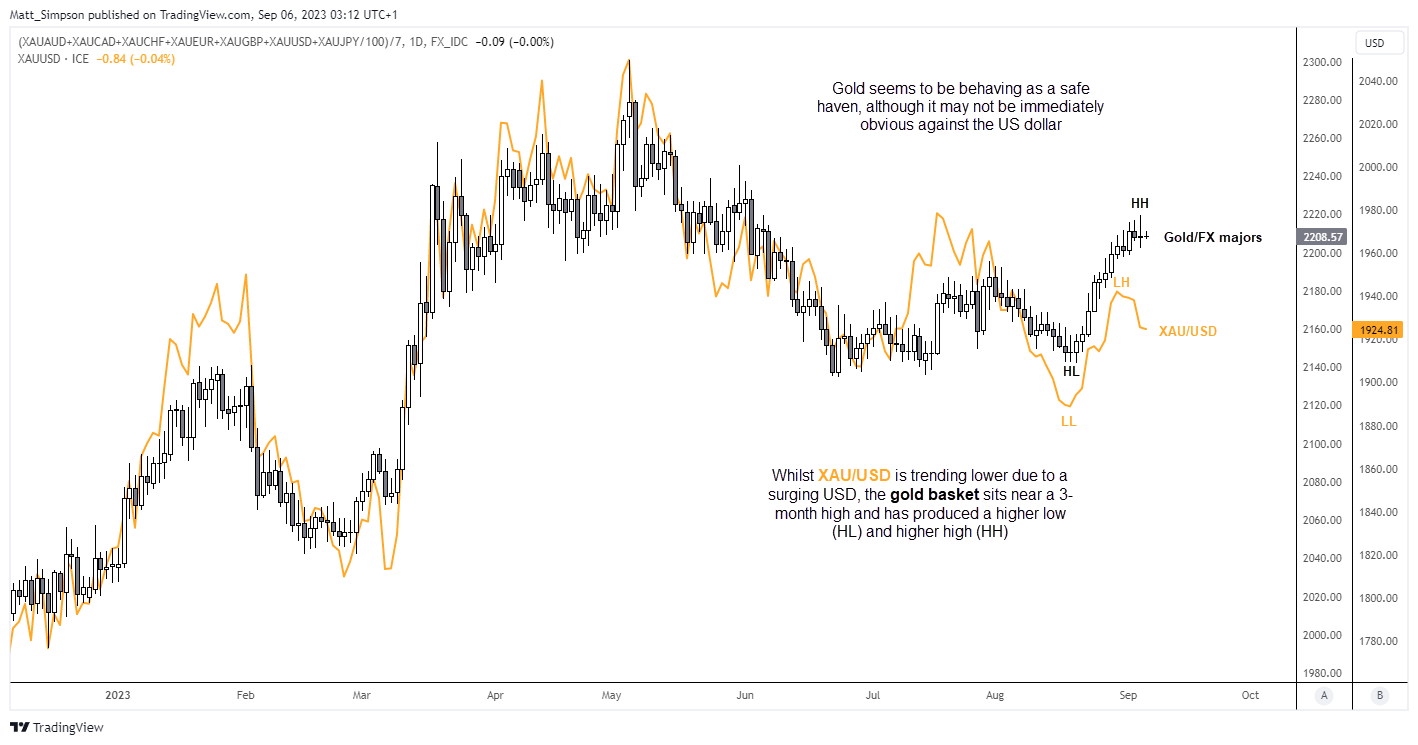
Despite competing with the strength of the dollar, gold has been trading higher against all other major currencies since its low in August. This suggests that gold is acting as a safe haven, even if it is not immediately obvious from the XAU/USD chart.
The chart below shows an equally-weighted gold basket against the classic XAU/USD spot chart. Although these two charts typically move in tandem to show the overall strength or weakness of gold, there is a slight divergence emerging, indicating that the weakness in XAU/USD is primarily due to a stronger US dollar.
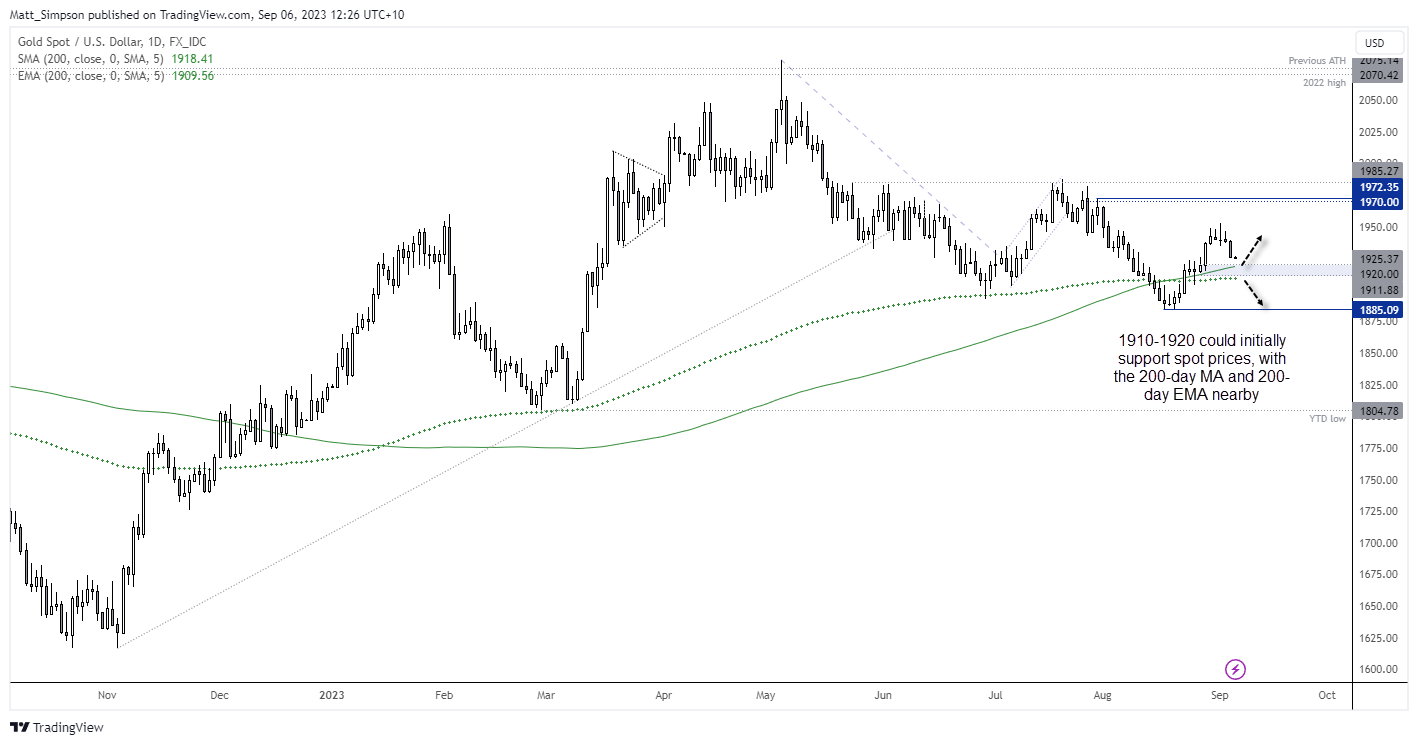
And concerns of a global slowdown simply add to the case for the Fed to hold rates in September, further provides a degree of support for gold. And with the 200-day average sitting around 1920, it could find a level of support over the near-term, unless yields continue to surge higher.
Gold technical analysis (daily chart):
Momentum has turned lower for gold against the dollar, but there are some key levels of support nearby which could at least slow any bleeding. The 200-day EMA sits around 1910 and the 200-day average just below 1920, which makes the 1910-1920 zone a likely level of support over the near-term. Of course, if the rally on yields and the US dollar peters out, it could certainly help build a case for gold prices to bounce against the dollar.
Should prices build a base above the 1910-1920 zone, perhaps it could muster up a bounce to the 1940-1950 region, but for now I’ll revise lower my original expectation of a simple rally to 1970. A break beneath 1910 brings 1900 and the 1985 low into focus for bears.
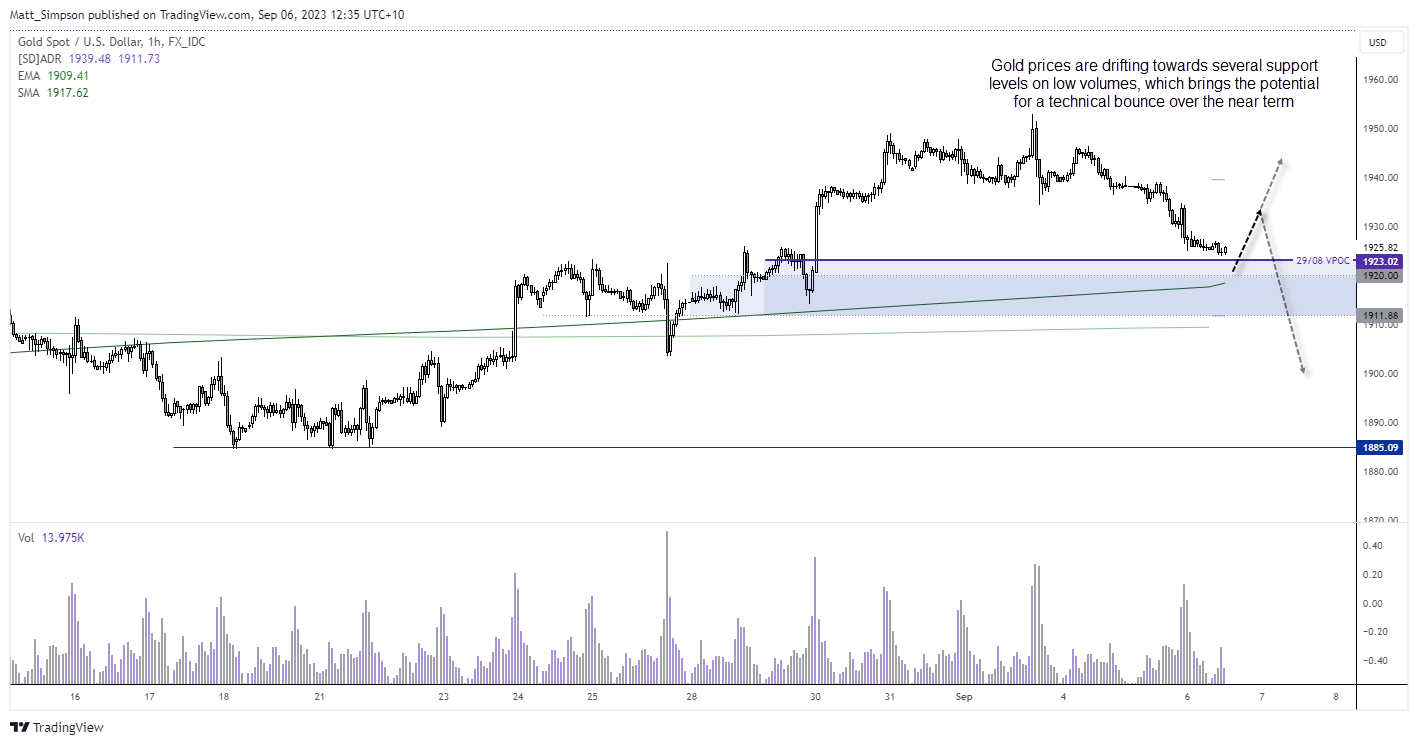
Gold technical analysis (1-hour chart):
The 1-hour chart shows gold prices are drifting lower towards several support levels on relatively low volumes, which brings the potential for a technical bounce over the near-term. At 1923.3 we have an untested daily VPOC (volume point of control) and of course the round number 1920 nearby. 1930 or the pivotal level around 1934 could be a viable near term target for bulls, at which point we’d like to reassess its potential to continue higher or form a swing high on this timeframe.
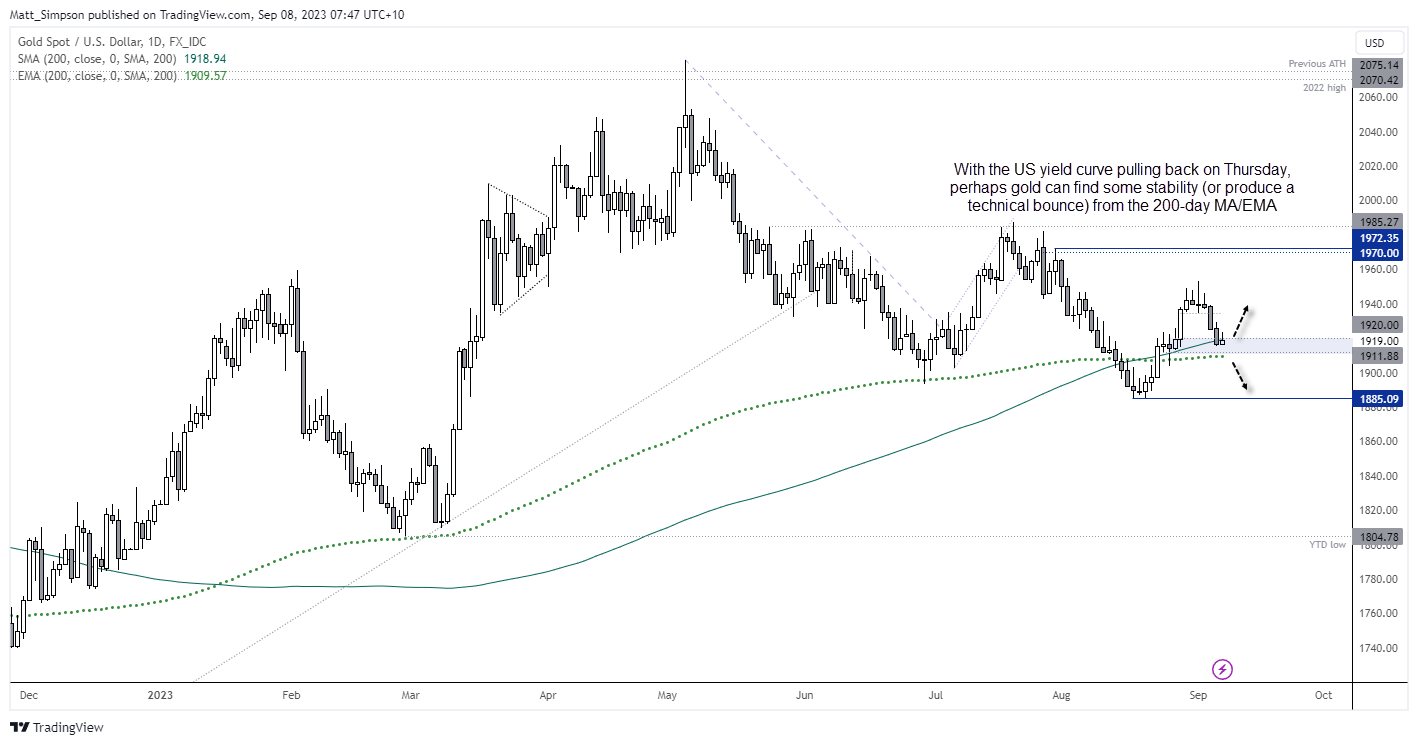
Gold technical analysis (daily chart): 8.9.23
We have seen gold prices pull back in line with my bias laid out earlier this week. Gold is showing signs of stability around the 200-day average and 200-day EMA, and a simple-weighed gold basket against FX majors remains near its cycle highs, to show the pullback on XAU/USD has mostly been due to the strength of the US dollar. With US yields showing signs of weakness around current cycle highs, perhaps the US dollar can low some steam and help gold print a minor bounce from current levels.