The last few weeks and months have been pretty hard for the market. Other than select commodities, everything else in the market has been selling off due to the Fed’s tightening plan. The rate hikes and quantitative tightening plan cause a selloff in all asset classes including stocks, bonds, as well as precious metals. Gold has fared relatively well compared to other asset classes, but GDXJ (Gold Junior Miners) is not immune to the general risk off. In this article, we will update the current outlook for GDXJ.
GDXJ Monthly Elliott Wave Chart
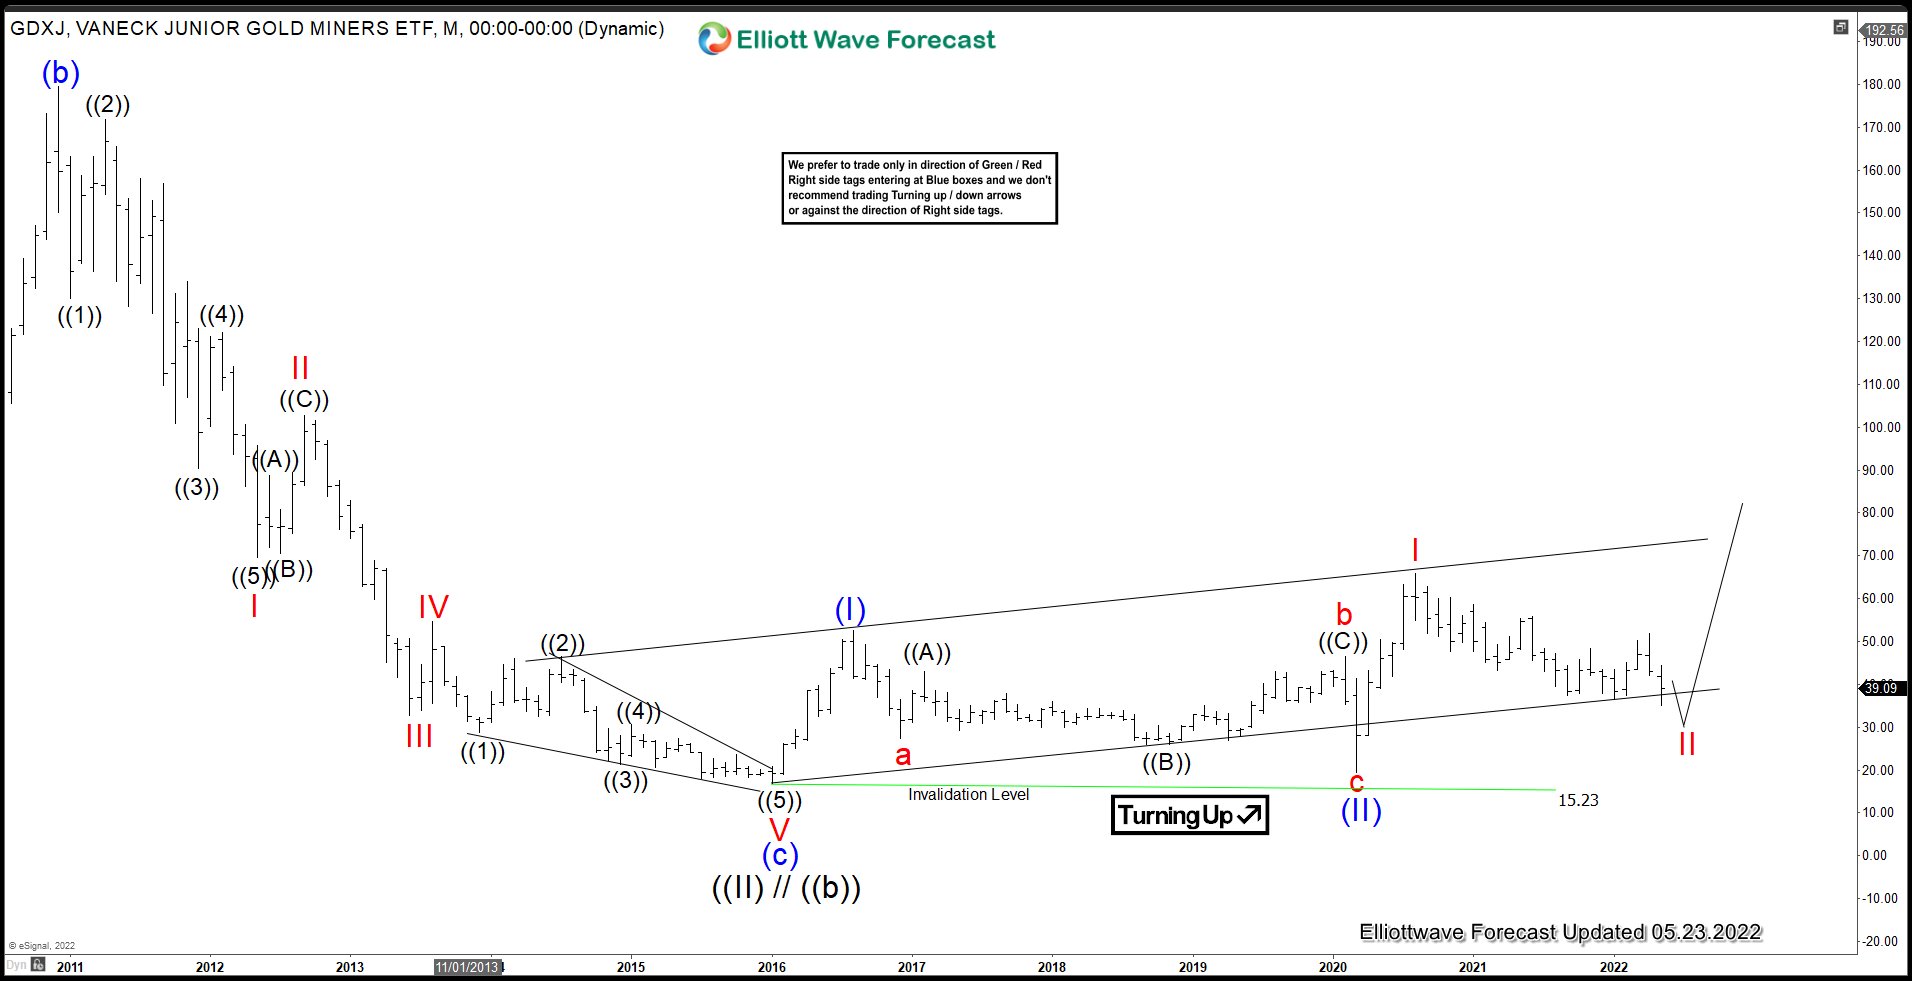
GDXJ Monthly chart above shows that it has formed a wave ((II)) / ((b)) pullback at 15.23. The rally from there so far is a 3 overlapping swing, but it’s unlikely that it will break below January 2016 low (15.23) again. The rally from January 2016 low is in the form of a nesting 5 waves impulse. Up from wave ((II)), wave (I) ended at 52.50 and pullback in wave (II) ended at 19.52. Then the ETF rallied again in wave I towards 65.95. As long as wave II pullback holds above 19.52, expect the ETF to extend higher again.
GDXJ Daily Elliott Wave Chart
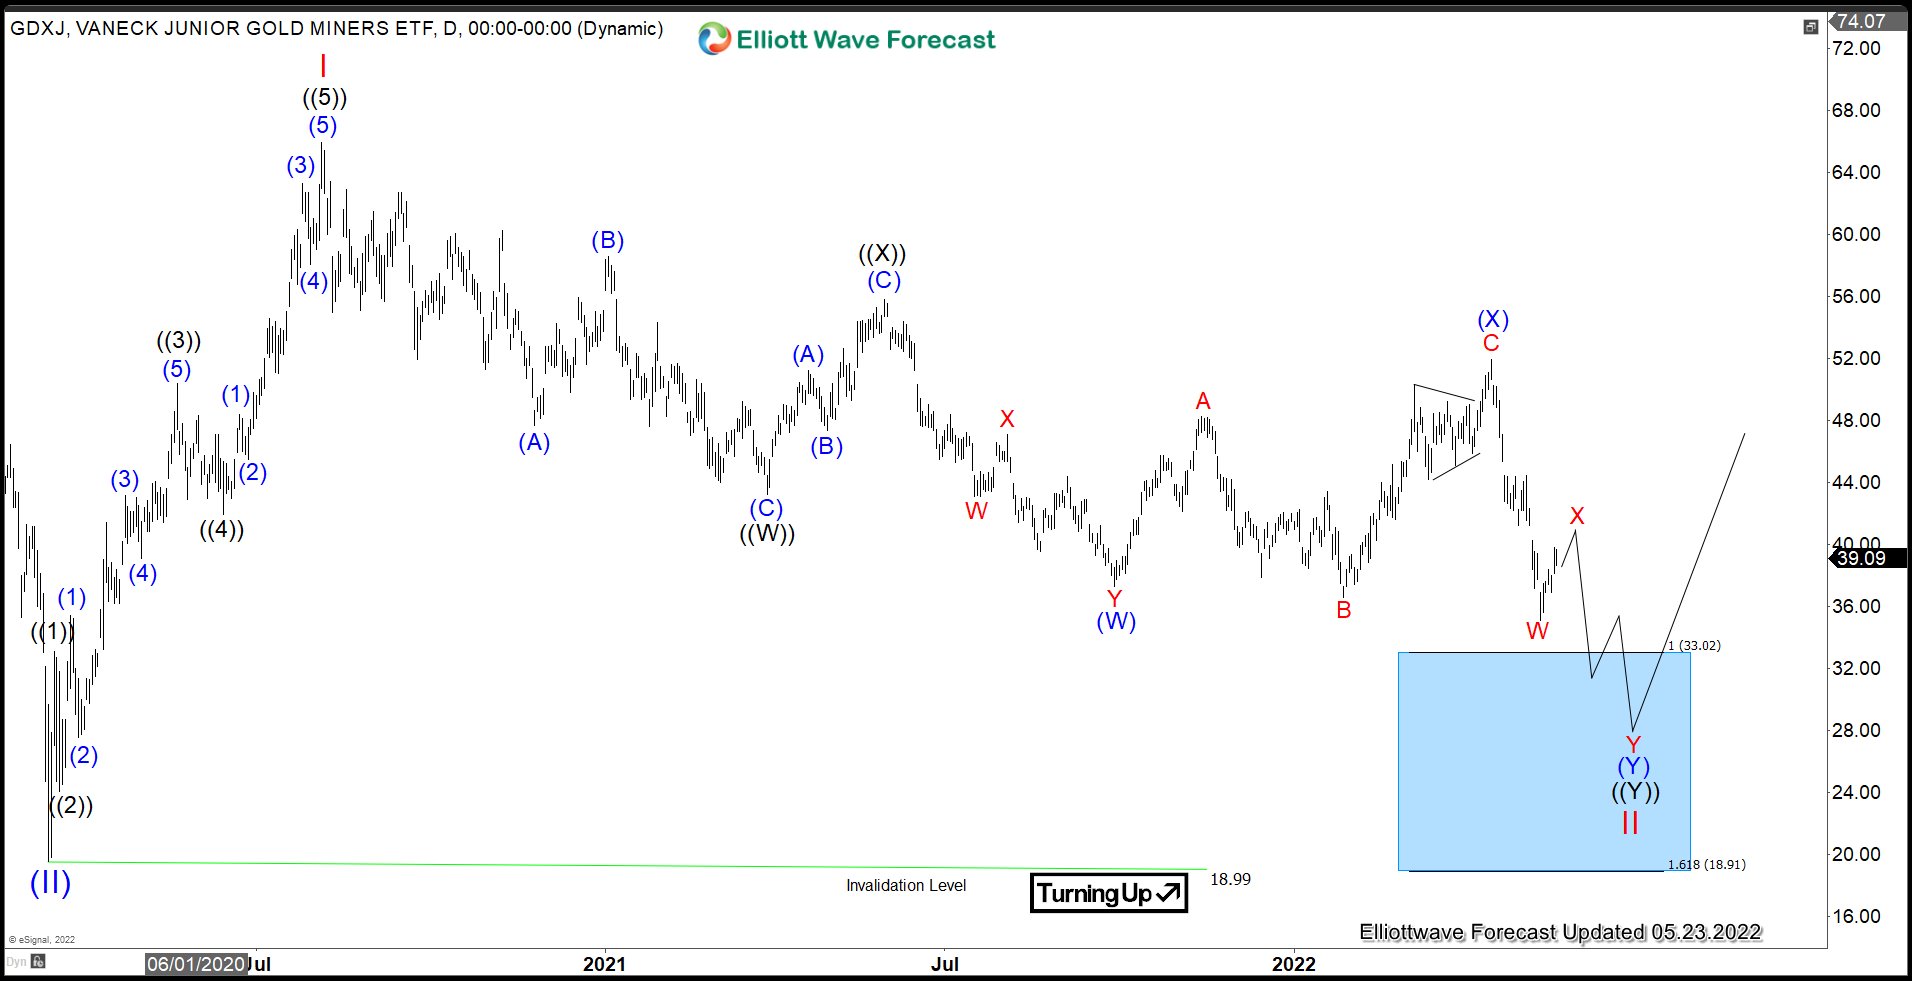
Daily Chart of GDXJ above shows that the ETF is correcting cycle from 3/13/2020 low in wave II. The internal subdivision is unfolding as a double three ((W))-((X))-((Y)) where wave ((Y)) can see further downside to reach the blue box area of 18.91 - 33.02 before it ends wave II and turns higher. This blue box area is the 100% - 161.8% Fibonacci extension of the ((W)).