Market Summary:
- Oracle (ORCL) fell over -13% during its worst day’s trade in 21 years after it reported slower growth of its cloud business
- Apple’s stock price (AAPL) fell as much as -2.5% during intraday trade After unveiling the iPhone 15 and other products such as the first ‘carbon neutral’ Apple Watch Series 9
- Oracle was the worst performer on the S&P 500 and another underwhelming product launch from Apple saw sentiment across Wall Street dented, with tech stocks leading the way lower
- UK wages were stronger than expected, yet weak employment figures fanned fears of stagflation and saw money markets trim expectations for further hikes slightly
- The British pound failed to hold on to initial gains and teased with a break beneath the 200-day EMA, with a stronger US dollar on the even of a key IS inflation report also playing its part
- Oil price continued to rise after OPEC maintained its bullish demand forecast for 2023 and 2024 and the Energy Information Administration (EIA) said its expected global inventories to decline by around 50% this year
- WTI crude oil broke out of its 5-day consolidation to the upside, reached a 10-month high and traders ~$1.20 from $90
- 95% of economists polled by Reuters now favour the Fed holding interest rates at next week’s FOMC meeting
- Slightly mixed numbers from the ZEW economic sentiment survey saw Germany’s current conditions fall to a 37-month low yet expectations tick up to a 2-month high
- Australian consumer sentiment continued to fall according Westpac Bank, who noted that the “cost of living and inflation remain key drags” on confidence and that households remain concerned about their finances despite being “less fearful” of rate hikes
Events in focus (AEDT):
- 09:50 – Japan’s PI, BSI large manufacturing conditions, Reuters Tankan survey
- 16:00 – UK GDP, construction/manufacturing/industrial output, index of services, trade balance
- 22:30 – US inflation
- 23:15 – BOE deputy governor Mann speaks
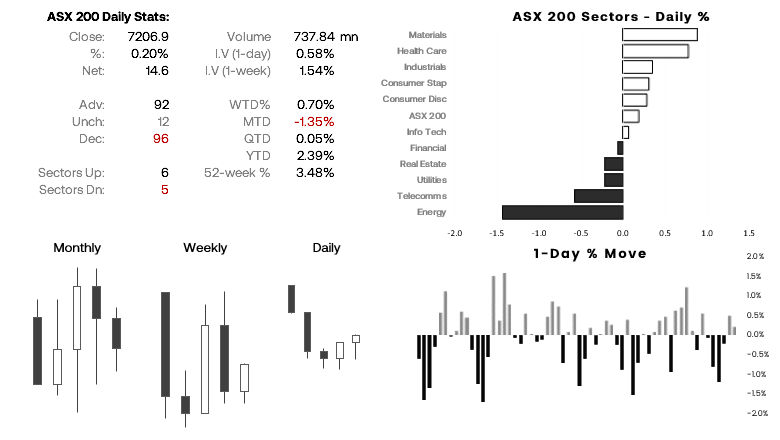
ASX 200 at a glance:
- The ASX 200 pulled back into Monday’s range and traded higher (in line with yesterday’s bias) before finding resistance around the 200-day EMA
- A weak lead from Wall Street and softer SPI futures reiterate the importance of resistance around 7200
- Given the US inflation report is looming, we have a flat bias today
- Going forward, we need to see a decent break above 7200 / 200-day EMA before we can get more excited a the potential that Monday was indeed a key swing low
- A break beneath Monday’s low also breaks the March 2020 trendline and brings 7100 into focus.
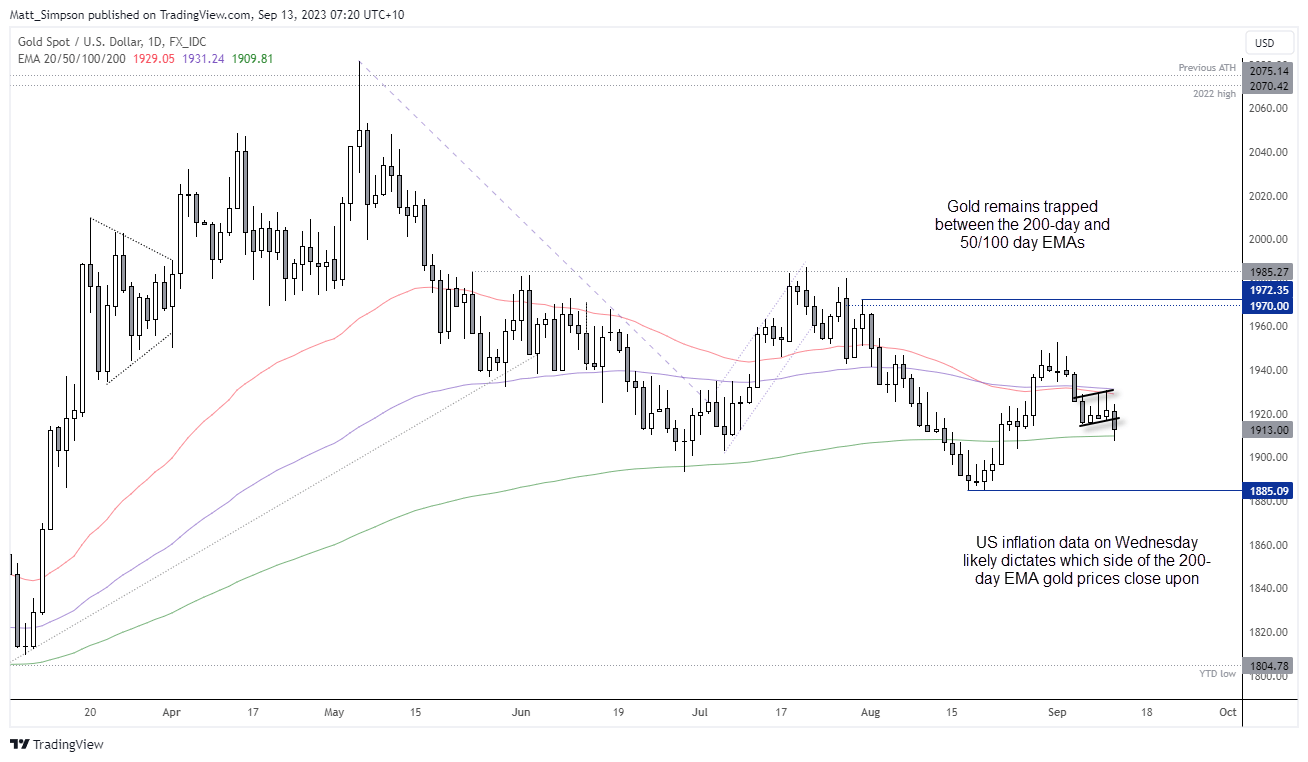
Gold technical analysis (daily chart chart):
Momentum for gold prices turned lower and saw spot prices touch a 12-day low, before the 200-day EMA came to the rescue. With all eyes on today’s CPI report it remains firmly in the hands of the inflation report as to which side gold may finish on today. But with odds of choppy price action leading into the event likely high, we’d prefer to seek opportunities on lower timeframes.
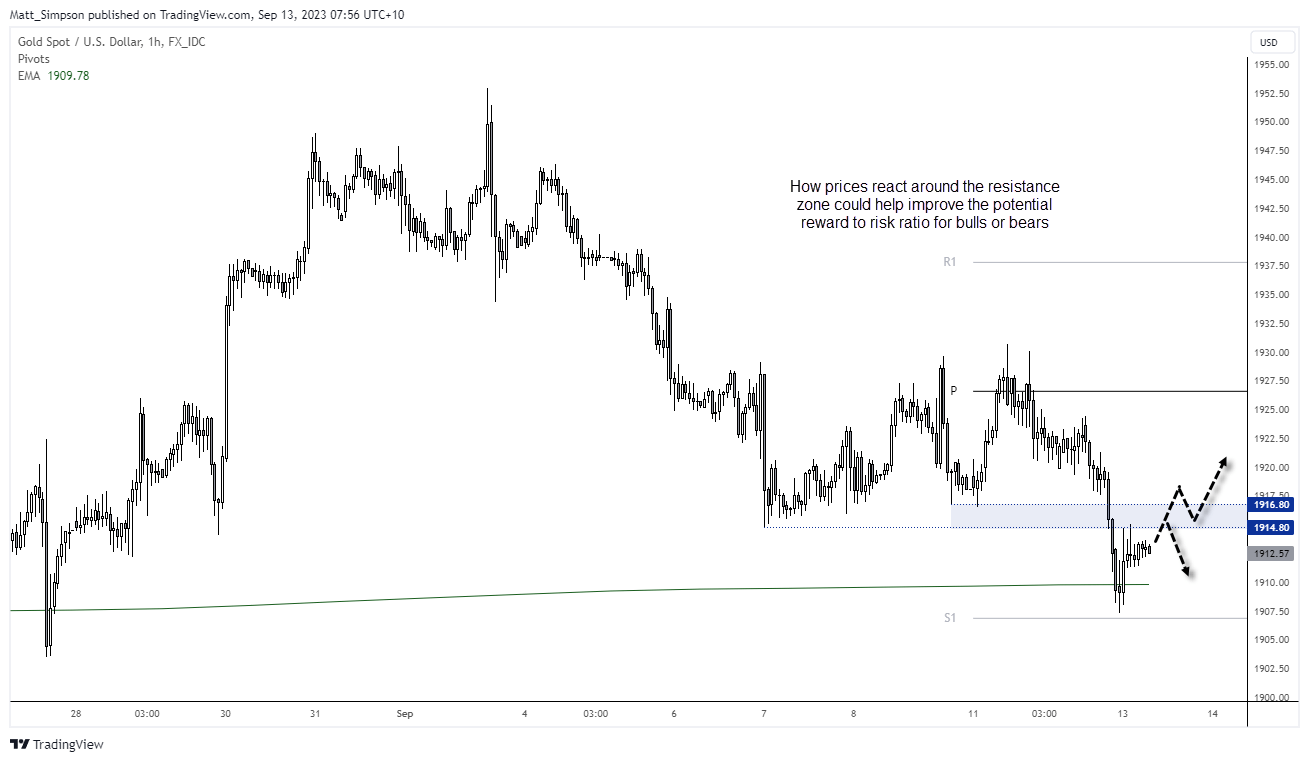
Gold technical analysis (1-hour chart chart):
Reward to risk can be a useful filter to decide if a trader wants to partake in any market. Taking the gold 1-hour chart as an example, it may not seem favourable for bulls or bears around current levels on this timeframe gives prices are midway between key support (200-day EMA) and the resistance zone. However, should prices drift into the resistance zone and form a reversal bar (or series of bearish reversal bars) around the resistance area then, perhaps we could consider a cheeky short towards the 200-day EMA. Or if prices manage to break above the resistance zone, and show evidence of a swing low around it, perhaps a long could be considered. Otherwise, we’d prefer to remain flat.