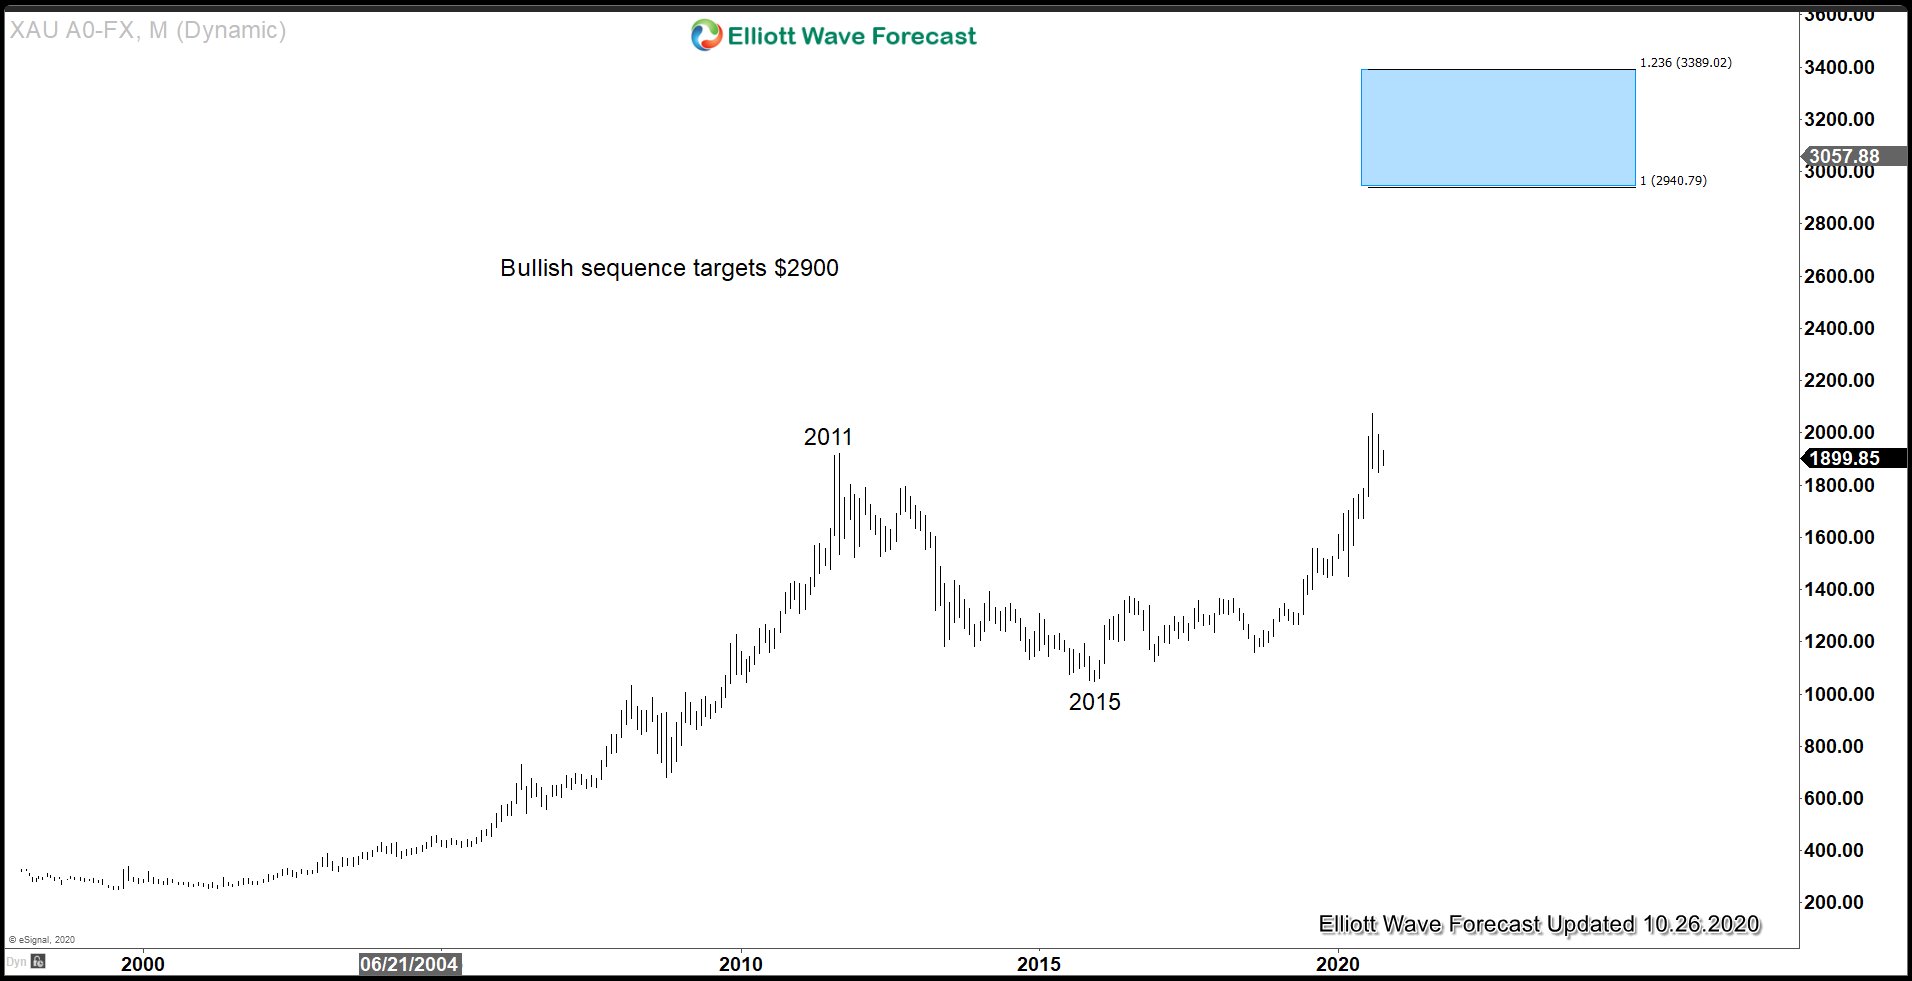
Government and corporations around the world continue to accumulate unsustainable debt. Since it’s unthinkable for developed countries such as the United States to default on the obligation, the only way out of this situation is to continue to debase currencies. This environment is very supportive for Gold and Silver in coming years. Indeed, Gold has broken to new all-time high against all other world currencies including US Dollar. The chart below in Gold suggests a simple 100% extension from all-time low should see Gold reaching $2900 as a conservative target.
Furthermore, Gold-to-Silver ratio also confirms the direction of Gold and Silver remain bullish as the chart below suggests. Gold-to-Silver ratio is the ratio of gold price / silver price.
Gold-to-Silver Ratio Weekly Chart
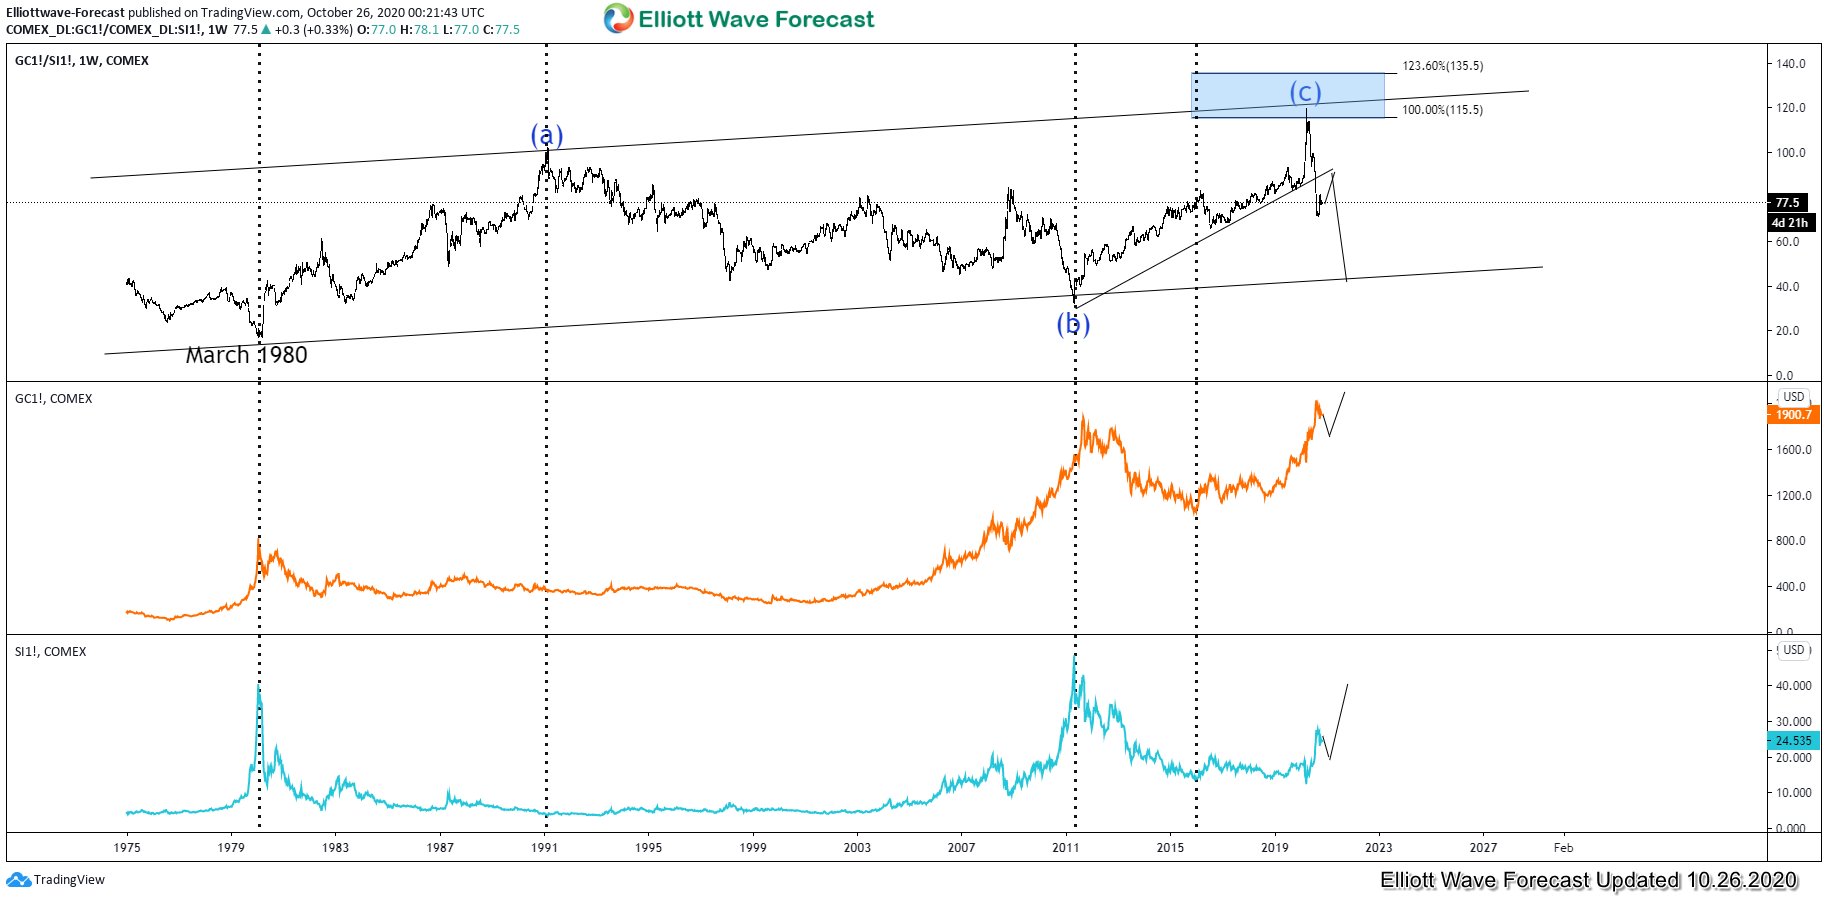
The chart above shows an overlay of Gold-to-Silver ratio chart (top chart) with Gold (middle) and Silver (bottom). We can observe an inverse correlation between the ratio and the price of the underlying metals. The dotted vertical line above shows important swing high and low in the instrument. In between the vertical lines, we can see when the ratio formed significant peak, the price of gold and silver formed significant low and vice versa.
We can also see the ratio has reached perfect 100% - 123.6 extension blue box from March 1980 in 3 swing. From the blue box, the ratio reversed down violently. The current decline has broken below 2011 rising trend line suggesting the uptrend has ended. Expect the ratio to continue lower in coming years with possible next target at around 40 which is the lower end of the multi decade channel. Due to the inverse correlation, we can expect the price of Gold and Silver to continue higher in coming years.
Gold-to-Silver Ratio 4 Hour Elliott Wave Chart
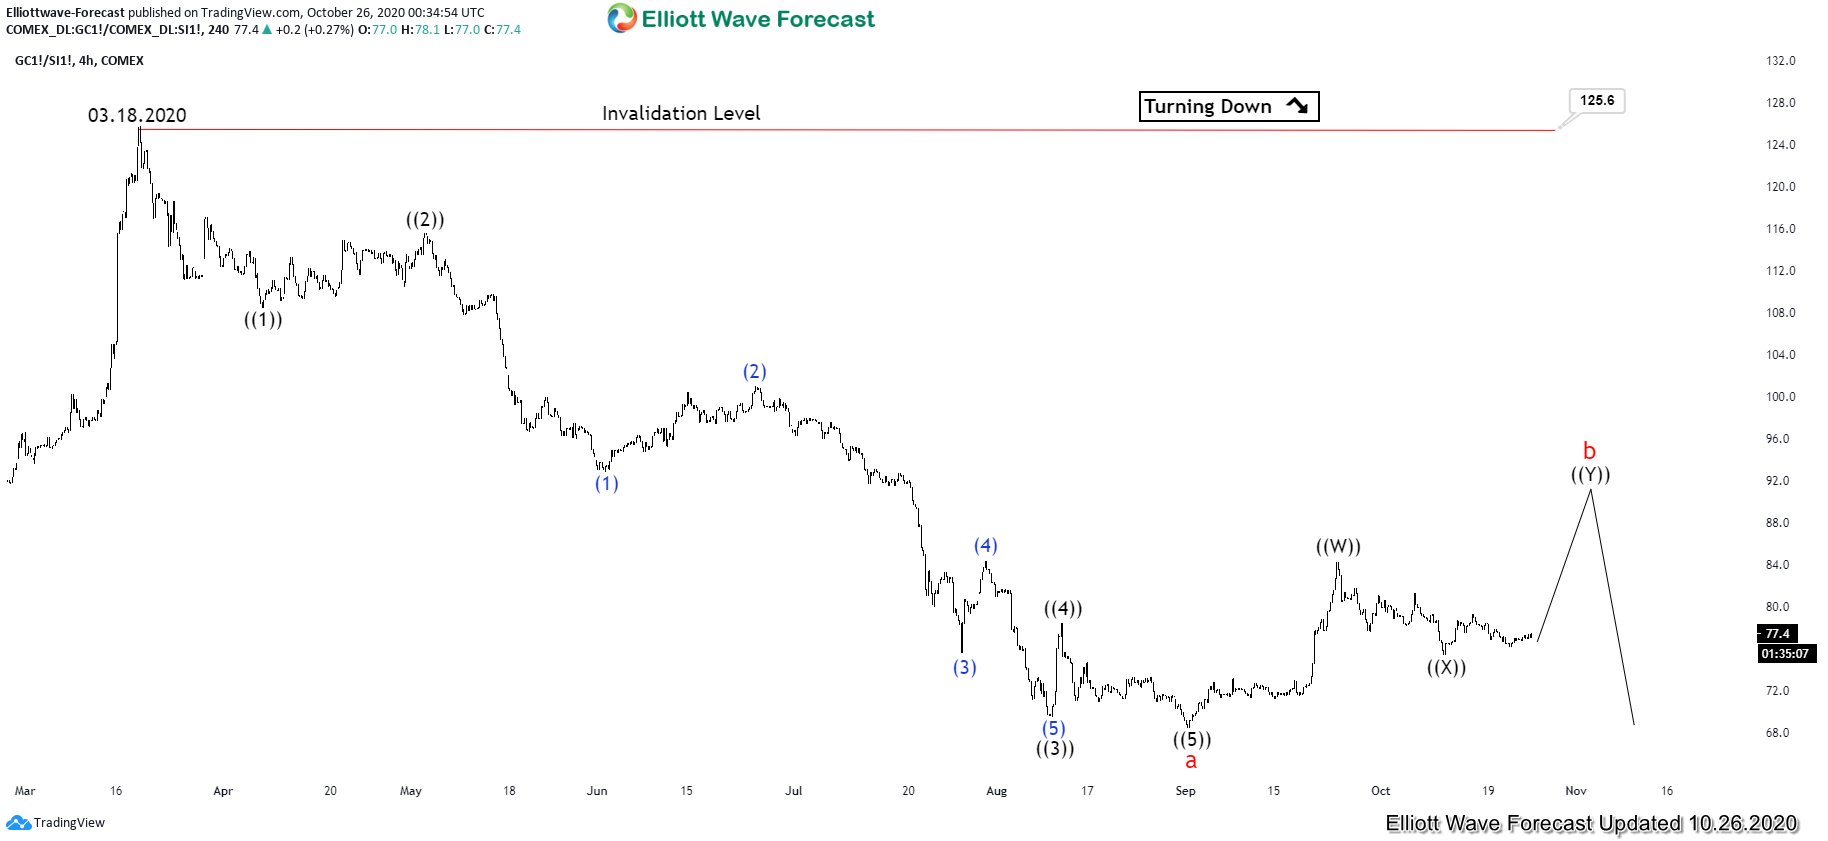
4 hour chart of Gold-to-Silver ratio above shows a 5 waves impulsive structure from March 18, 2020 high. Short term, another leg higher still can’t be ruled out to end wave b before the ratio turns lower again. If the ratio is still doing another leg higher as expected, then we can’t rule out further correction in Gold and Silver due to the inverse correlation. Afterwards, when the ratio starts turning lower again, the price of Gold and Silver can start to extend higher.