GOLD is showing bullish sequences in the cycle from the 1614.3 low. Recently we got 3 waves pull back that has reached our buying zone. In the further text we are going to explain the Elliott Wave Forecast.
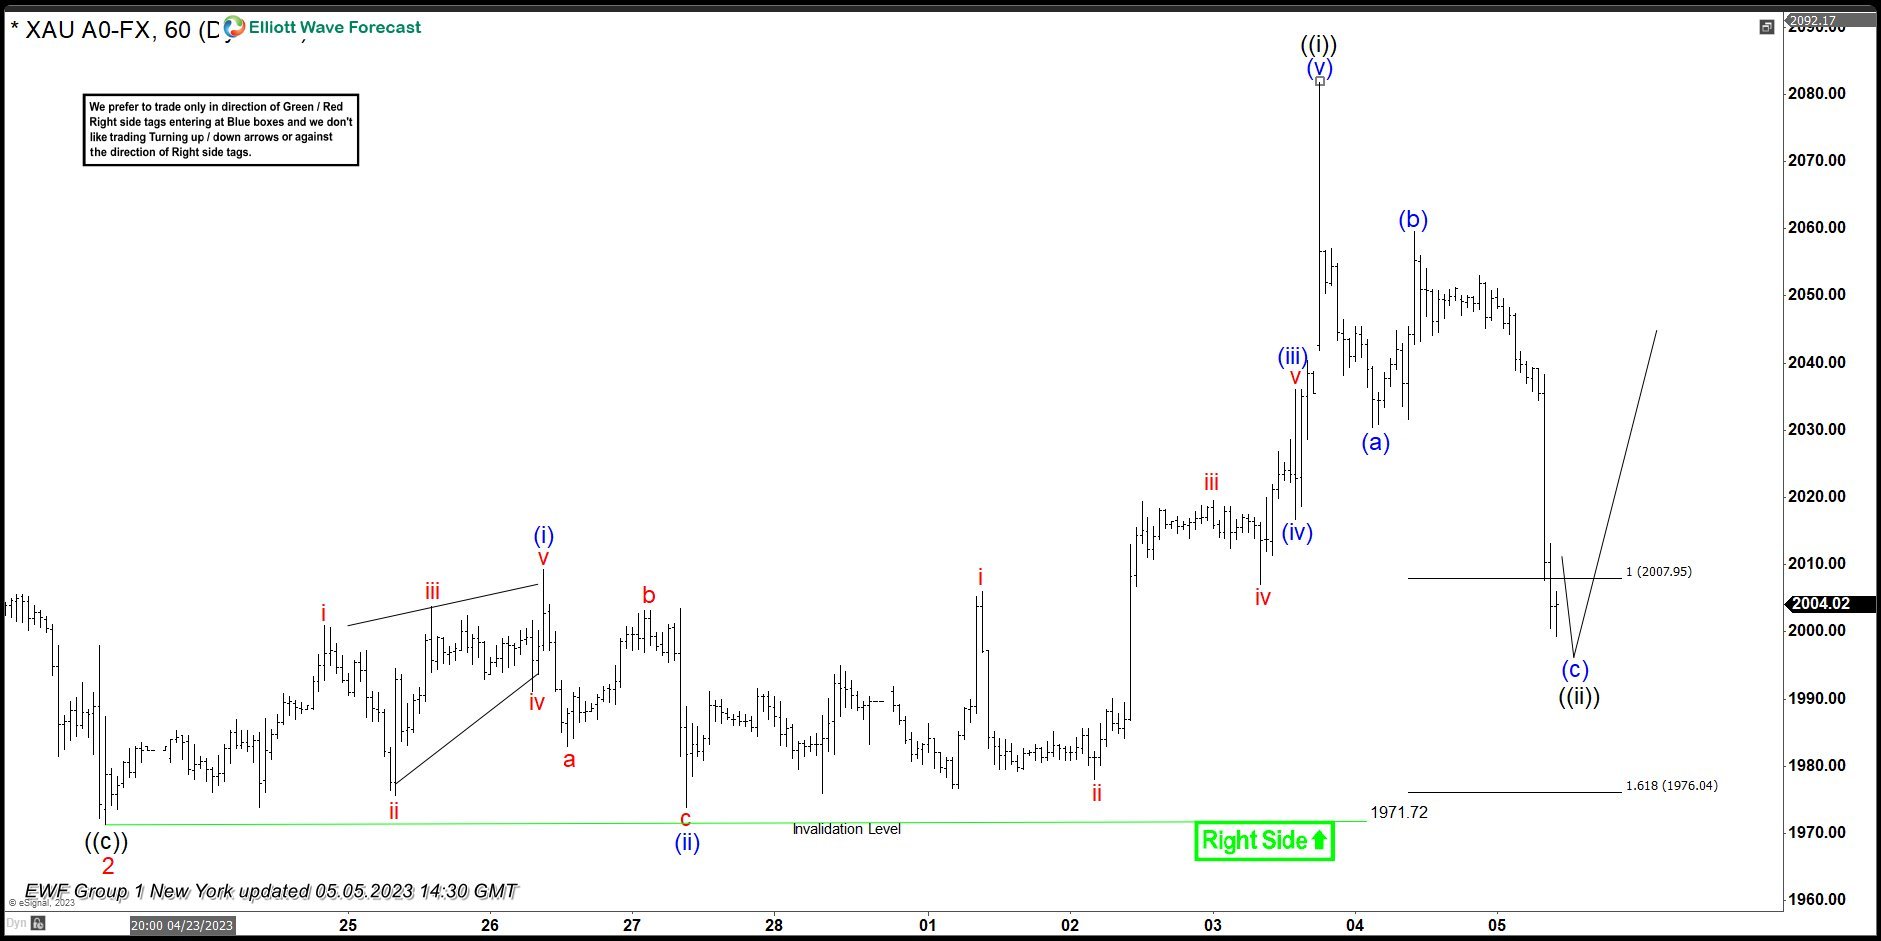
GOLD Elliott Wave 1 Hour Chart 05.05.2023
Current view suggests that cycle from the 1971.7 low ended as 5 waves rally and now the commodity is giving us pull back. The price structure already shows 3 waves down from the peak. GOLD has reached extreme zone at 2007.9-1976.04 and pull back can complete any moment. We don’t recommend selling the commodity against the main bullish trend and favor the long side. From the marked area we expect to see rally toward new highs or 3 waves bounce alternatively.
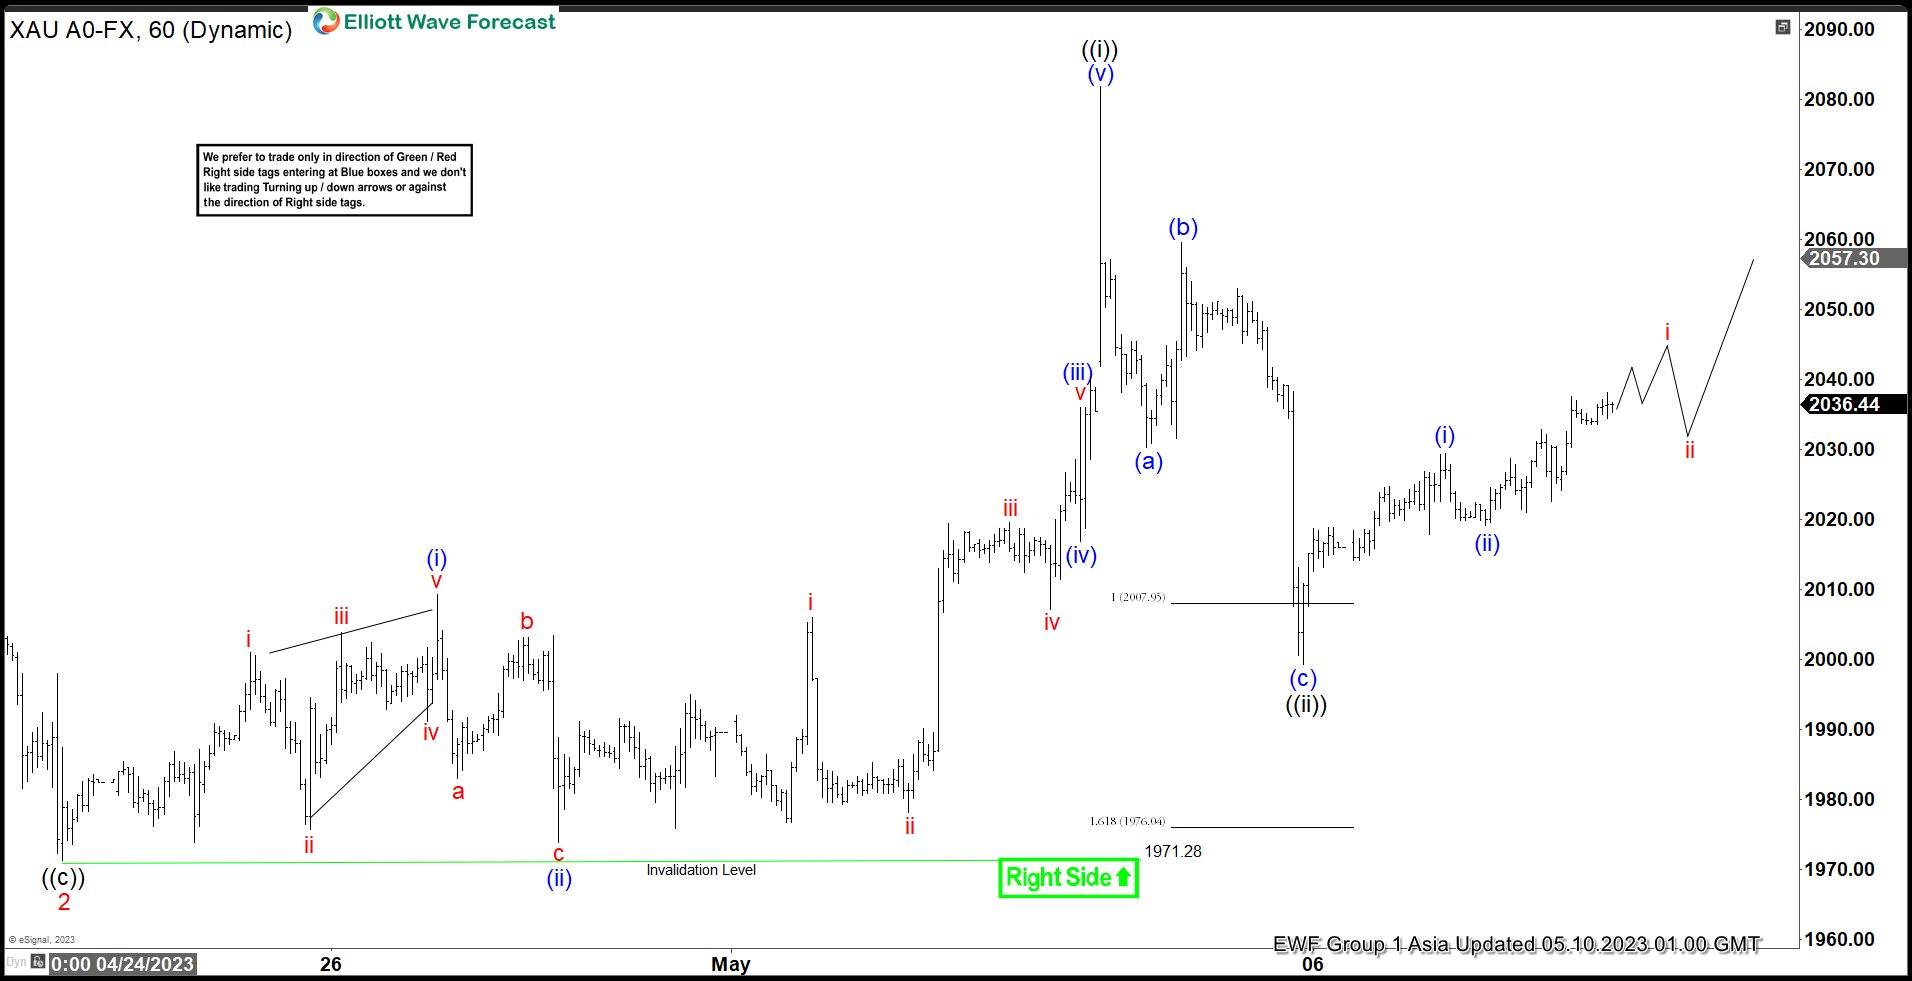
GOLD Elliott Wave 1 Hour Chart 05.10.2023
The commodity found buyers at the Equal legs zone and we are getting good reaction from there. Current view suggests wave ((ii)) pull back ended at 1998.9 low. Rally from the zone reached and exceeded 50 fibs against the (b) blue connector. So, any longs from the equal legs area should be risk free with partial profit taken. We would like to see break above (i)) black peak to confirm next leg up is in progress.