The Goldman Sachs Group, Inc. (GS) is an American multinational investment bank and financial services company headquartered in New York City. It offers services in investment management, securities, asset management, prime brokerage, and securities underwriting. The company invests in and arranges financing for startups, and in many cases gets additional business when the companies launch initial public offerings. Notable initial public offerings for which Goldman Sachs was the lead bookrunner include those of Twitter, Bumble, Robinhood Markets, Coupang, etc.
GOLDMAN SACHS (GS) JUNE DAILY CHART
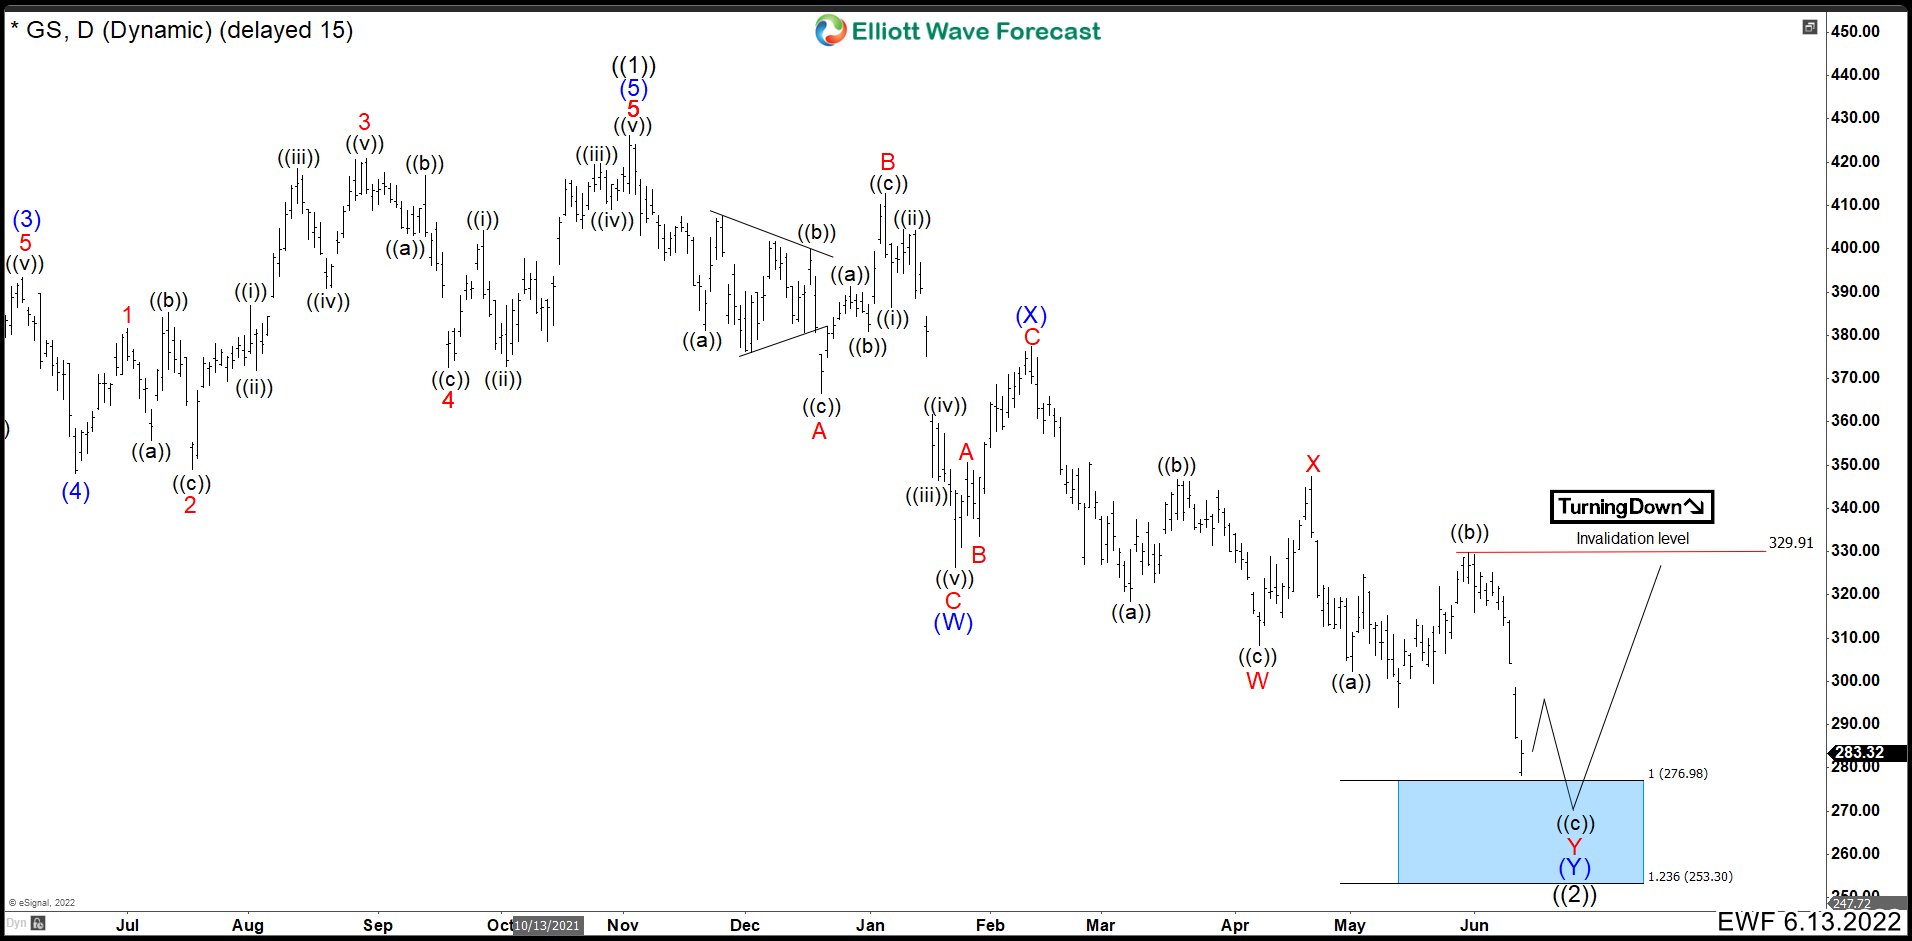
In June, we were looking to finish the cycle correction that started in March 2020. The March cycle built momentum which we call wave ((1)) and ended at 426.39. The pullback took the form of a double correction. At the end, GS needed one more low towards the blue box area in 276.98 - 253.30 to complete the wave ((2)). From here, we expected to continue the bullish trend. (If you want to learn more about double correction or Elliott Wave Theory, follow these links: Elliott Wave Education and Elliott Wave Theory). The Rally continue higher than expected; therefore, we have adjusted the count labelling wave (1) higher as we show in the next chart.
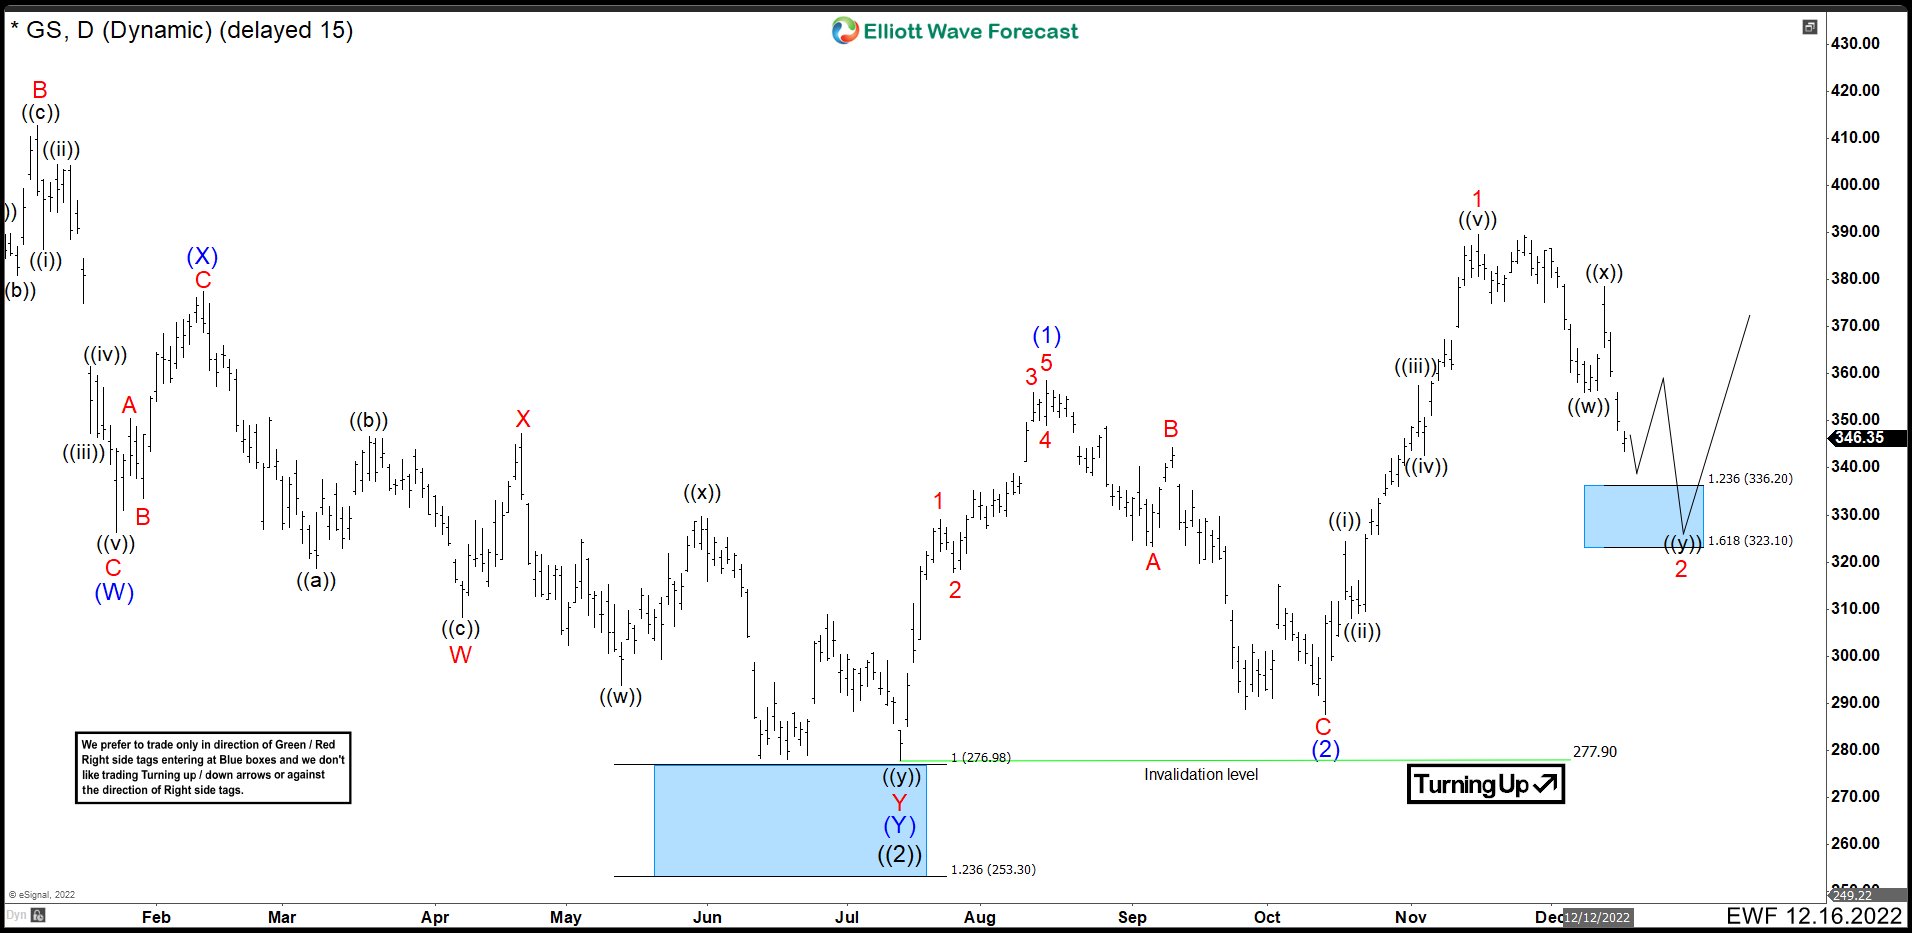
The saw a new low, but unfortunately it was very slight and it did not reach the blue box for a few cents. Wave ((2)) ended at 277.90. The rally continues and we can see 5 waves to the upside that ended at 358.52. We call this rally wave (1). We then got a very deep zig zag pullback that was close to breaking through the invalidation level. Wave (2) ended at 287.61 seeing a strong rebound again. This bounce formed another impulsive structure that ended at 389.51 and we call it wave 1. We expect the structure from the bottom of wave ((2)) to be a nest, which means that the current correction should remain above wave (2) to be valid. We expect a double correction as wave 2 to finish in the blue box at 336.20 - 323.10 and GS to continue higher.
GOLDMAN SACHS (GS) DECEMBER ALT DAILY CHART
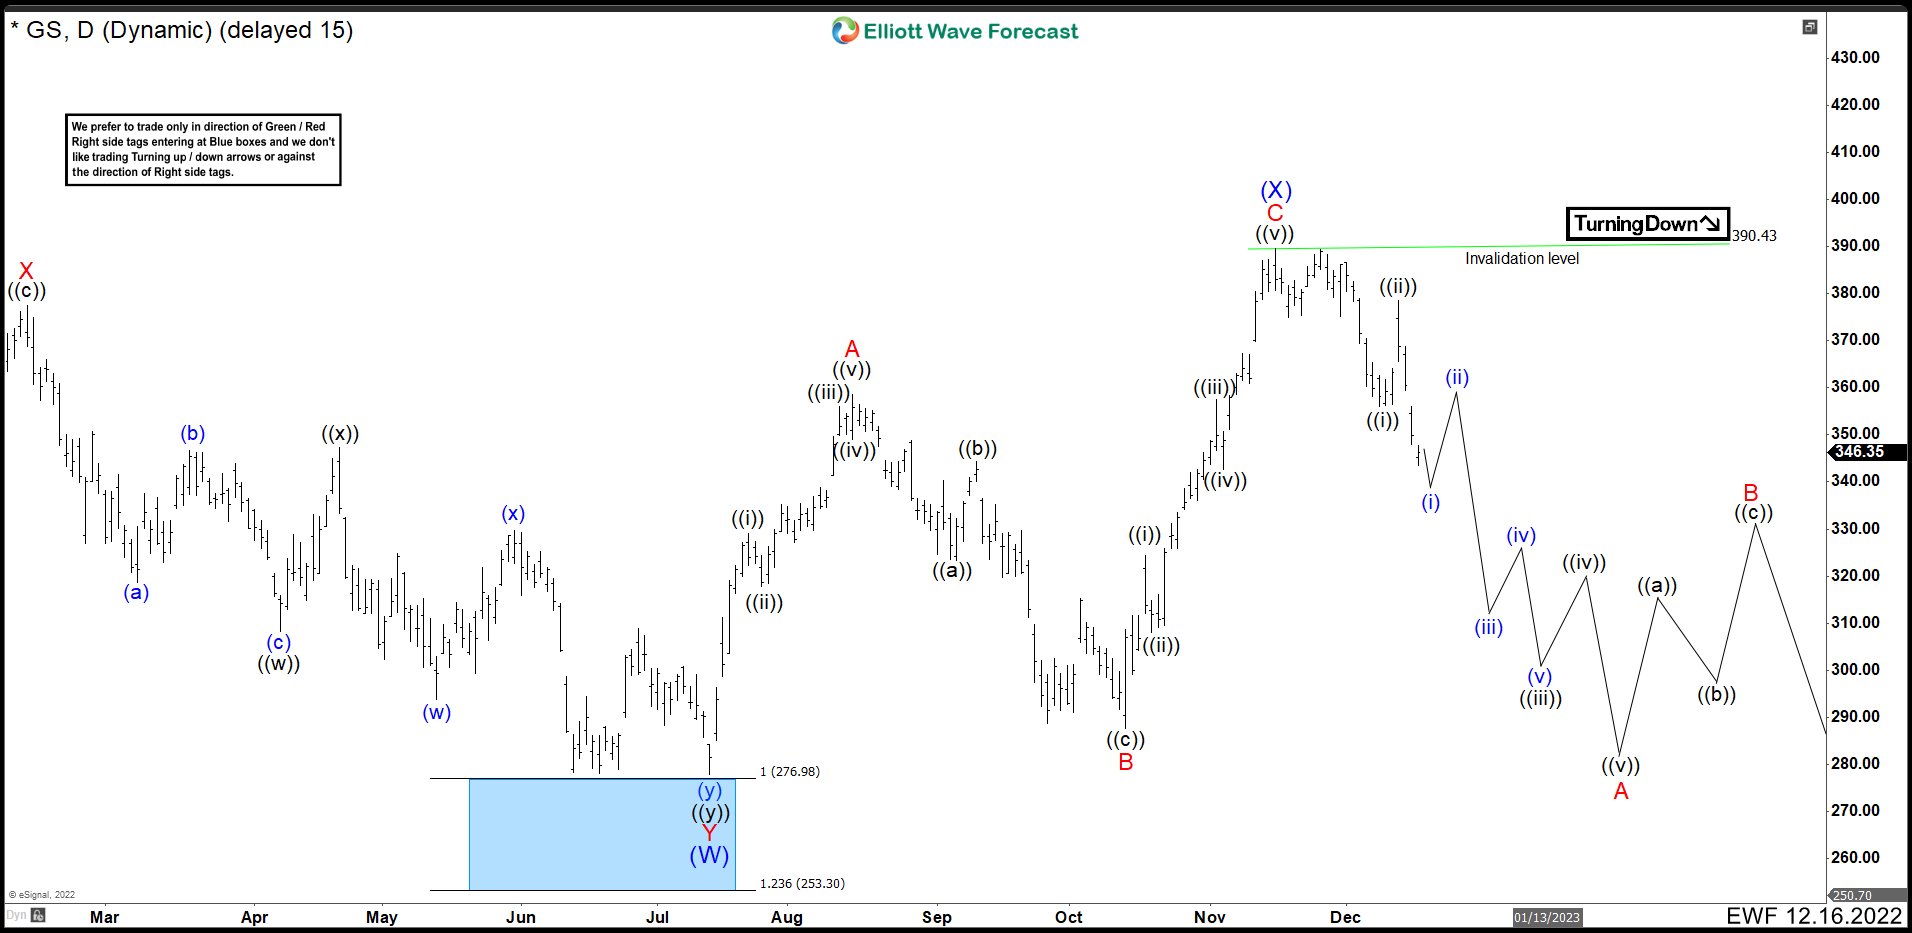
To confirm the count, the bounce from the blue box should break 390.43. If we don’t break the high, the 3 waves that started from the low of 277.90 could be corrective and not a nest. This would turn the structure from the November 2021 peak into a double correction and break wave (W) low. In the chart above, we can see how the GS structure could turn out if we fail to break the 390.43 high.
Source: https://elliottwave-forecast.com/stock-market/goldman-sachs-gs-rally-reaching-blue-box/


