Since the 2008 Financial Crisis, Goldman Sachs (NYSE: GS) established a new multi-year bullish trend which managed to break above 2007 peak after just 10 years joining the list of many other stocks which already achieved new all time highs in the previous years.
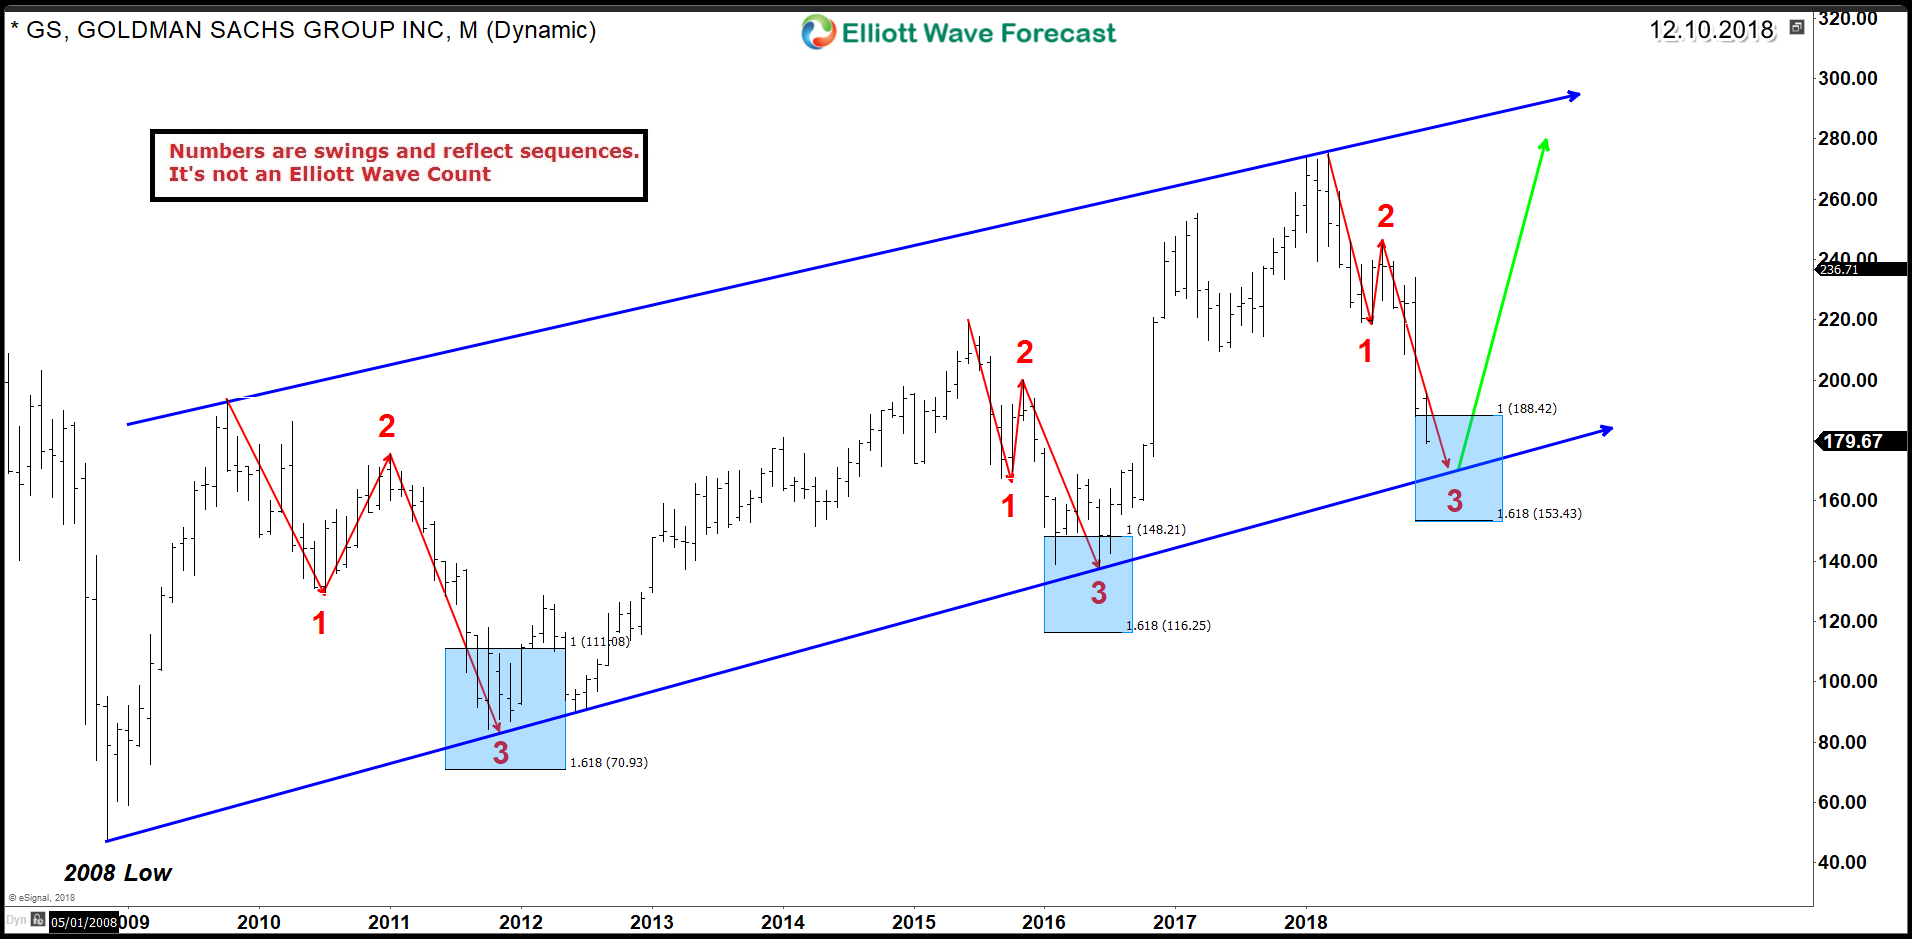
GS has been moving within a bullish channel making higher highs and higher lows. Every correction took place in a form of 3 swings lower into a blue box which is a High-frequency area where the market is likely to end cycles and make a turn. Now, the stock is approaching the lower end of the channel from where ideally the stock will be able the resume the move to the upside as long as the trend remain intact.
Goldman Sachs Monthly Chart
To understand the type of the 3 swings taking place at this stage, we switch to daily chart of GS and analyse the structures using the Elliott Wave Theory :
Goldman Sachs Elliott Wave Daily Chart
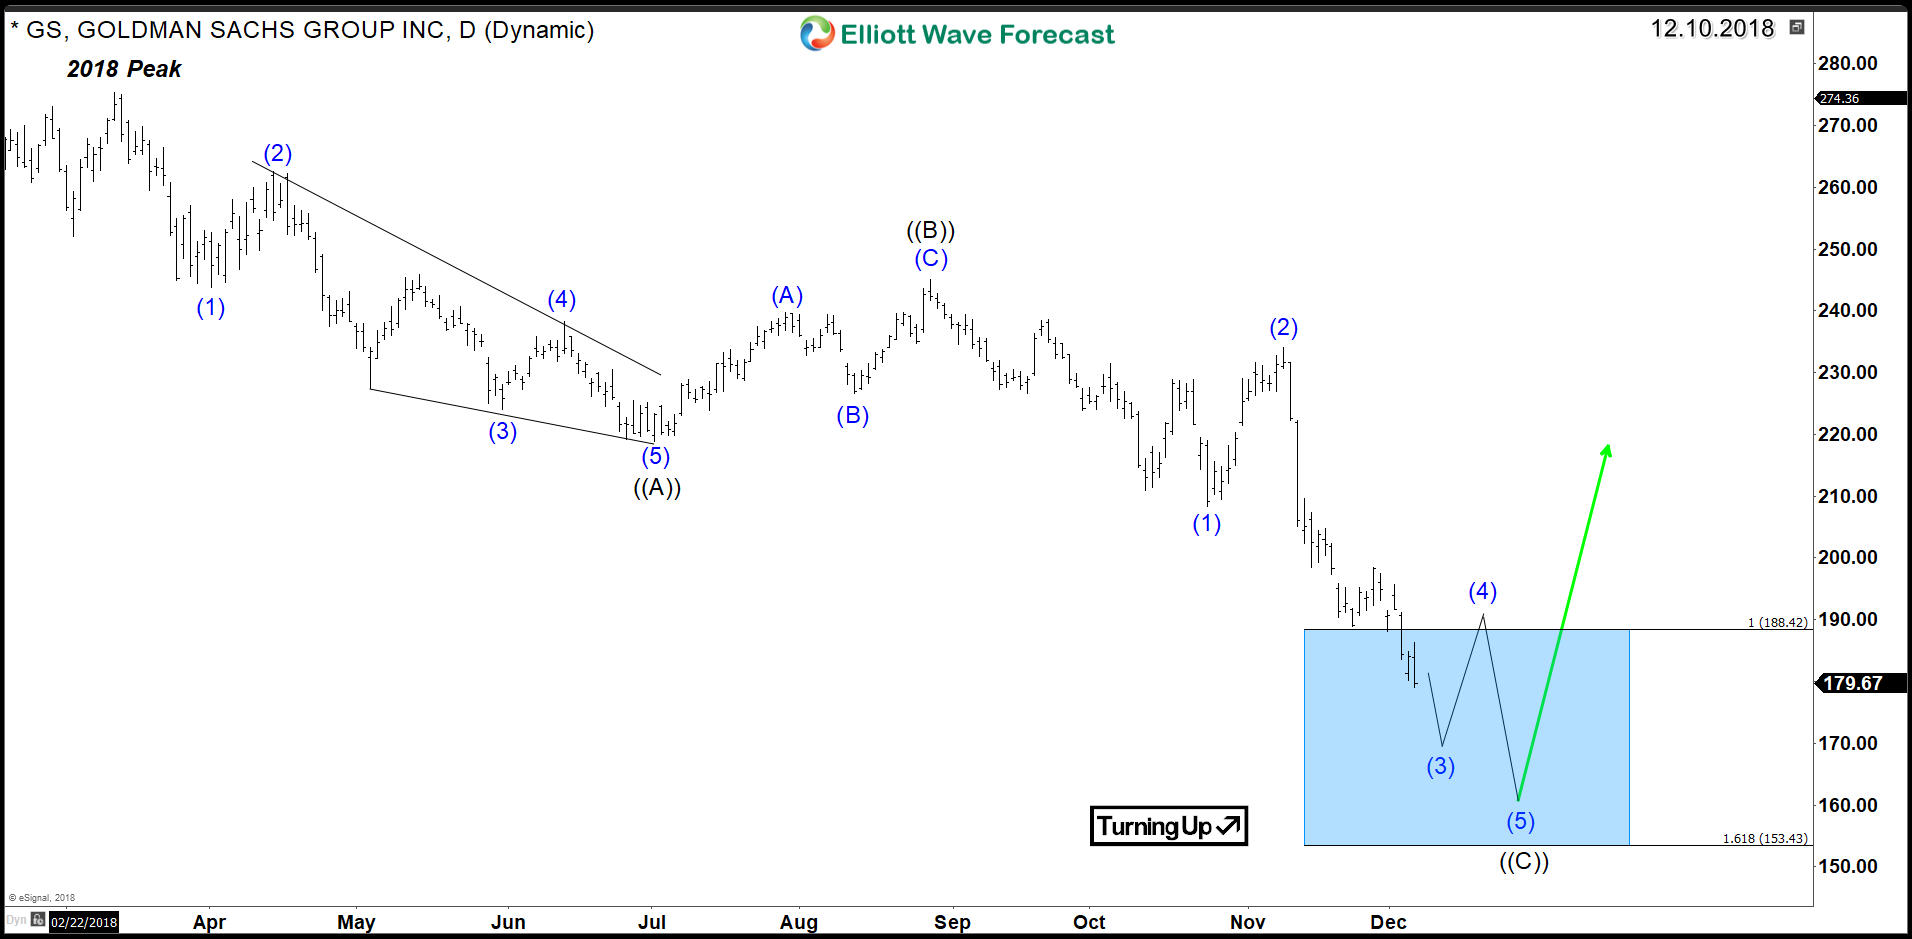
Since 2018 Peak, GS started the decline lower in a proposed classical ZigZag structure forming a corrective 3 waves move ((A)) - ((B)) - (©). The Stock has already reached the minimum target around the 100% Fibonacci extension area $188 with an extreme level at the 161.8% Fibonacci extension $153.4. Up from there, we expect the stock to react higher and resume the bullish trend looking for new all time highs or at least 3 waves bounce to the upside. However, if GS manage to exceed lower the extreme area then the move lower could turn into an impulsive structure to the downside ending the bullish trend since 2009 and could be starting a larger degree correction.
Corrections are always part of a healthy trend and can present a good opportunity to join it. Consequently, investors can be looking for a Long position within the mentioned buying area with a clear invalidation level.