Another good trading opportunity we have had lately is in GOOGL stock. Stock has been an impulsive rally since 10.4.2021 low with wave (1) completed at $2874.99, wave (2) completed at $2700, wave (3) completed at $2973 and it started pulling back within wave (4). Wave (4) took the form of a zigzag and presented a clear blue box extreme area where we expected buyers to enter to resume the rally in wave (5) or a reaction higher at least. In this technical blog we’re going to take a quick look at the charts of GOOGL Stock published in members area of the website.
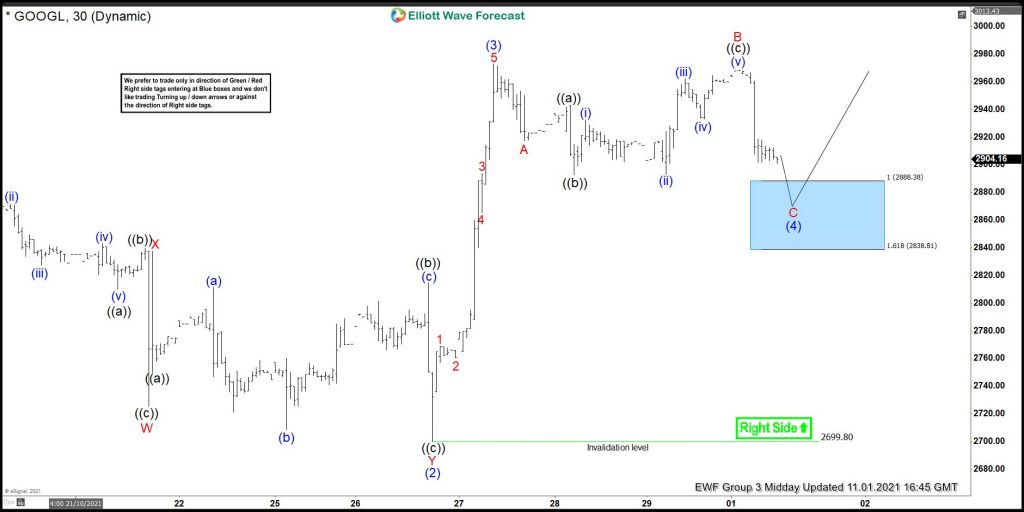
GOOGL Elliott Wave 1 Hour Chart 11.01.2021
Chart below shows wave (3) completed at $2973 which was followed by an Elliott wave zigzag correction. Wave B took the form of an expanded FLAT and wave C lower is in progress. Price is already very close to the blue box, another marginal push lower is expected to complete wave C and take prices lower toward $2888.38 - $2838.81 before buyers appear to resume the rally for a new high above $2973 in wave (5) or produce 3 waves reaction higher at minimum.
As our members know, Blue Boxes are no enemy areas , giving us 85% chance to get a bounce.
You can learn more about Elliott wave zigzag correction at our Elliott Wave Free Educational Web page
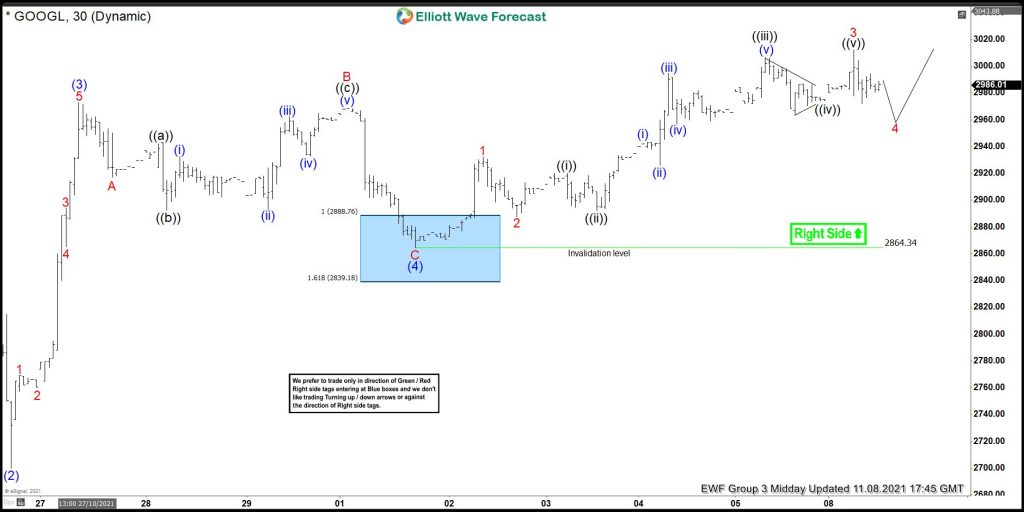
GOOGL Elliott Wave 1 Hour Chart 11.08.2021
Chart below shows wave (4) completed at $2864 and stock resumed the rally after buyers appeared in the blue box. We have already seen a new high in wave (5) but rally from wave (4) low is so far in 3 waves so we are still expecting a pull back and 1 more high. Minimum target for blue box buy has been reached at $2988.35 which is inverse 1.236 Fibonacci extension of wave (4) pull back. Another high is still expected within the proposed wave (5) and next level of interest would be the inverse 1.618 Fibonacci extension of wave (4) comes at $3039.87.

