In this technical blog, we will look at the past performance of 4 hour Elliott Wave Charts of Google stock ticker symbol: $GOOGL. In which, the rally from 23 March 2020 low unfolded as an impulse structure with an extended wave three. Therefore, we knew that the structure in GOOGL is incomplete to the upside & another push higher should happen to complete the 5 wave advance from March 2020 low. So, we advised members not to sell the stock & buy the dips in 3, 7, or 11 swings at the blue box areas. We will explain the structure & forecast below:
Google 4 Hour Elliott Wave Chart
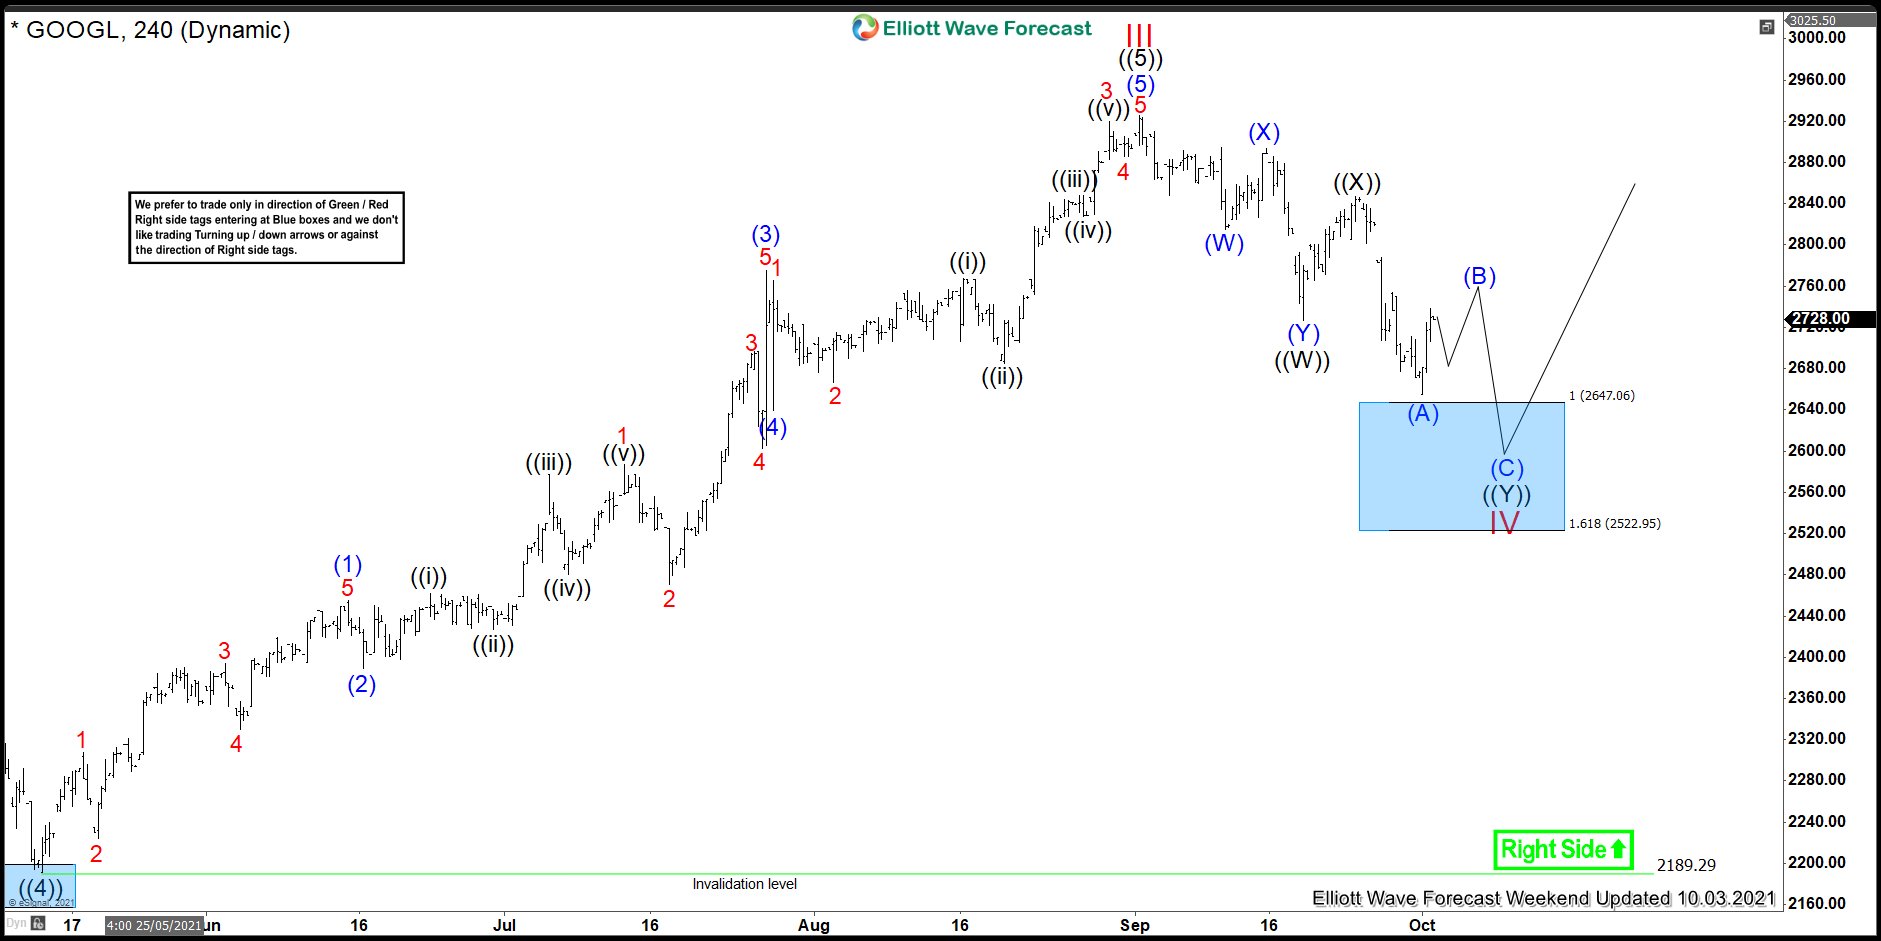
Here’s 4hr Elliott wave Chart from the 10/03/2021 Weekend update. In which, the cycle from 24 September 2020 low ended wave III in 5 waves structure at $2925.08 high & made a pullback in wave IV. The internals of that pullback unfolded as Elliott wave double three structure where wave ((W)) ended in 3 swings at $2726.44 low. Then a bounce to $2846.61 high ended wave ((X)) & started the next leg lower in wave ((Y)) with a lesser degree zigzag structure towards $2647.06- $2522.95 blue box area. From where buyers were expected to appear looking for new highs ideally or for a 3 wave bounce minimum.
Google 4 Hour Elliott Wave Chart
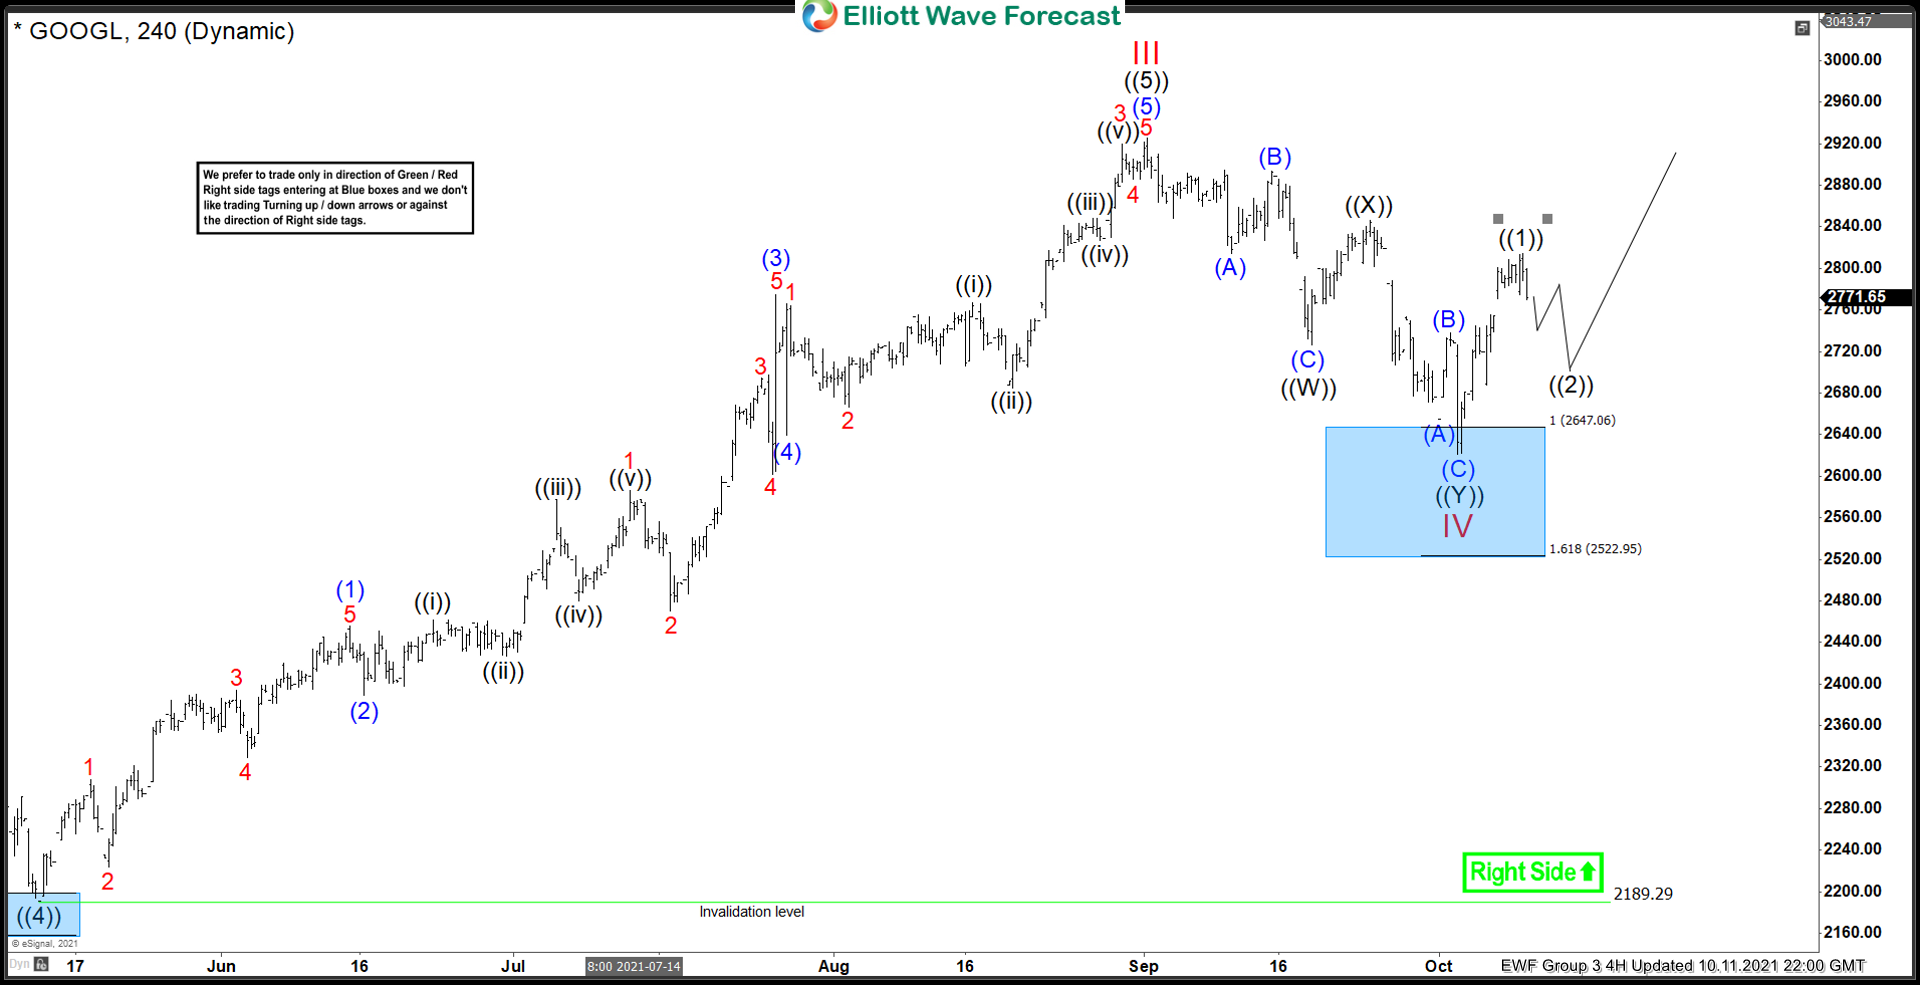
This is the latest 4hr Elliott wave Chart from the 10/11/2021 update. In which the stock is showing a strong reaction higher taking place from the blue box area at $2647.06- $2522.95. Right after ending the double three corrections within the blue box area. Allowed members to create a risk-free position shortly after taking the long positions at the blue box area. However, a break above $2925.08 high is still needed to confirm the next extension higher & avoid double correction lower.