Goodyear Tire and Rubber Company is a multinational tire manufacturing company based in Akron, Ohio, USA. The stock being a component of the S&P MidCap 400 index can be traded under ticker $GT at NASDAQ. As a matter of fact, Goodyear manufactures tires for automobiles, commercial trucks, light trucks, motorcycles, SUVs, race cars, airplanes, farm equipment and heavy earth-moving machinery. Currently, we can see commodities like oil, rubber, cotton turning higher against weakining US dollar. Hereby, Goodyear being one of the top four tire manufacturers worldwide should be a great opportunity for investors to diversify their portfolio by indirect investement in the rising commodity prices.
Goodyear Quarterly Elliott Wave Analysis 07.17.2021
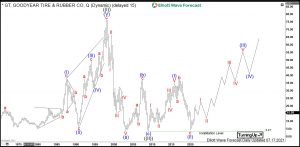
The Quartely chart below shows the Goodyear shares $GT traded at NASDAQ. First, the stock price has developed a leading diagonal higher in black wave ((I)) of a grand super cycle degree. It has printed the all-time highs in the first quarter of 1998 at 76.75. From the highs, a correction lower in black wave ((II)) has unfolded as an Elliott wave zigzag pattern with a truncated © wave. Frequently, lack of space to the downside makes many stocks truncate in the last swing without reaching the usual extension of 100%. Goodyear has printed an important bottom on the first quarter of 2009 at 3.17. As a matter of fact, the stock price has lost 96% of its value within 11 years.
From 2009 lows, a new cycle in wave ((III)) has already started and should extend towards 76.75 highs and beyond. Then, the target for wave ((III)) will be towards 80.05-127.53 area and even higher.
In shorter cycles, from 2009 lows a cycle higher in blue wave (I) has ended in the last quarter of 2015 at 35.30. From the highs, a correction lower in blue wave (II) has developed an expanded flat pattern. It has found a bottom in March 2020 at 4.09. From there, a new cycle in blue wave (III) of black wave wave ((III)) has started and should extend higher.
Goodyear Daily Elliott Wave Analysis 07.17.2021
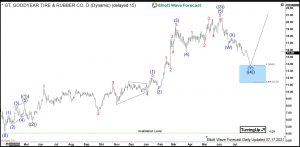
The daily chart below shows in more detail the first stages of the advance higher in blue wave (III). From the March 2020 lows, red wave I has developed so far waves ((1))-((3)). From the June 2021 highs, a correction lower in wave ((4)) is currently in progress. Now, it should find support in 7 or 11 swings above 5.73 lows. Currently, while below 17.83, a double three correction may reach into 13.81-11.33 blue box area. From there, a rally to new highs within wave ((5)) of red wave I or a bounce in 3 waves as minimum should take place.
Medium-term, investors and traders can be looking to buy $GT in a pullback in red wave II against 4.09 lows in 3, 7 or 11 swings targeting 80.05-127.53 area in a long run.

