Hang Seng Index Technical Analysis Summary
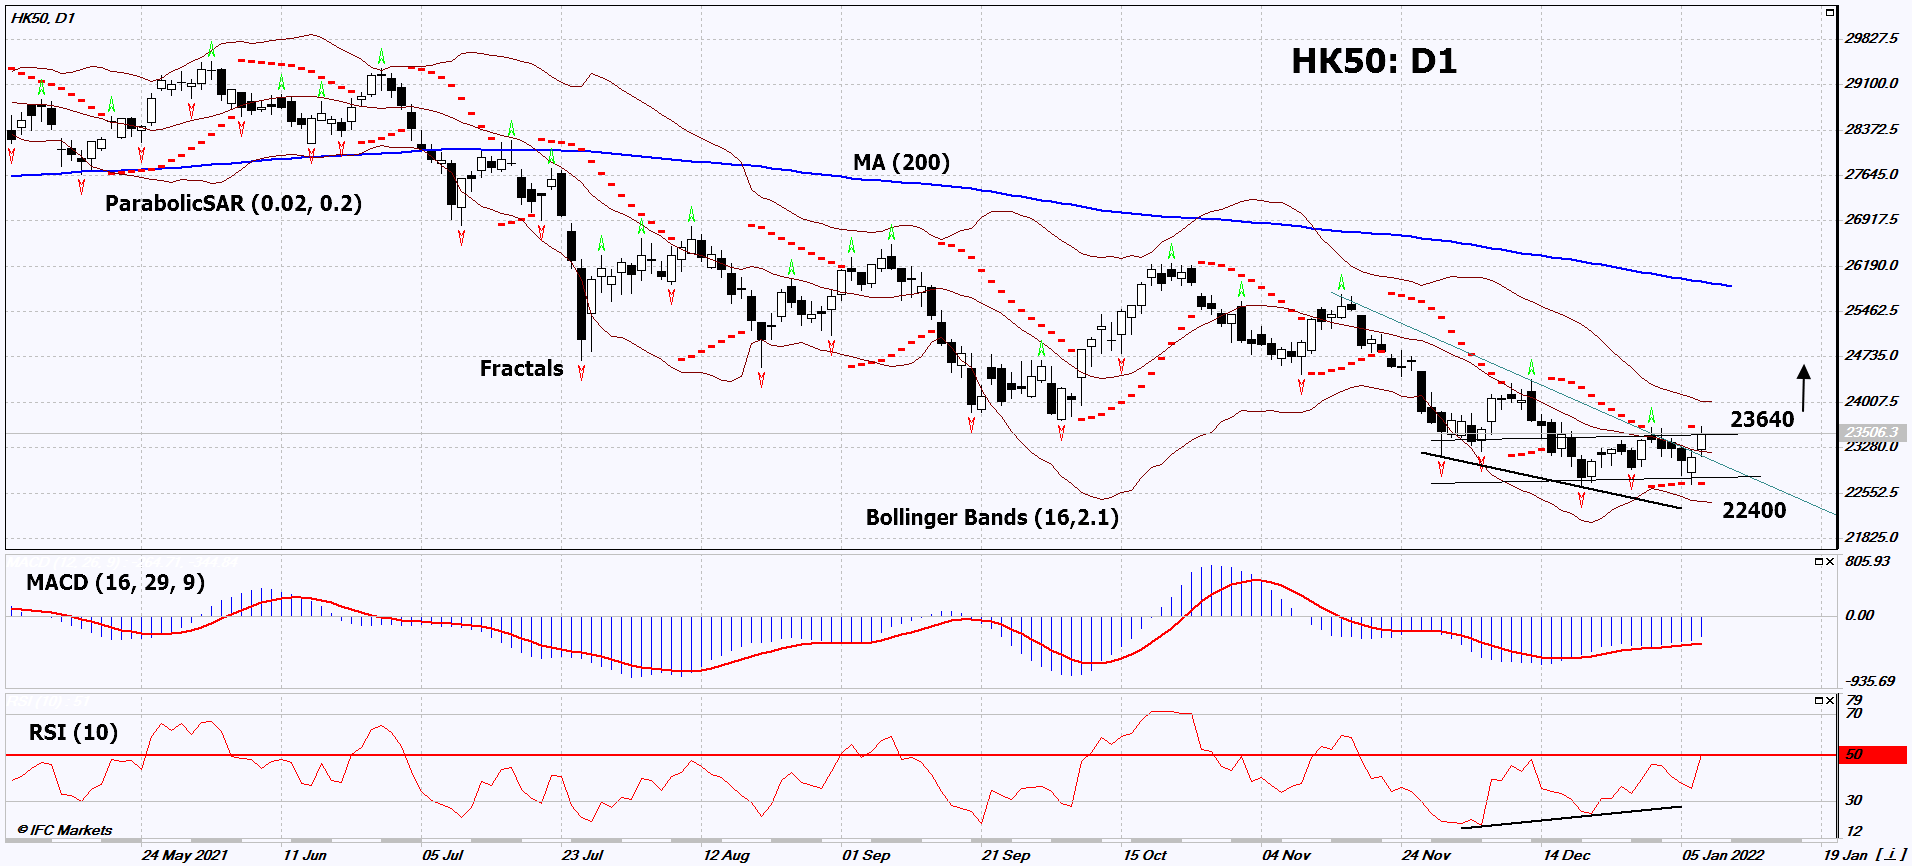
Buy Stop:Above 23640
Stop Loss:Below 22400
| Indicator | Signal |
|---|---|
| RSI | Buy |
| MACD | Buy |
| MA(200) | Neutral |
| Fractals | Buy |
| Parabolic SAR | Buy |
| Bollinger Bands | Neutral |
Hang Seng Index Chart Analysis
Hang Seng Index Technical Analysis
On the daily timeframe, HK50: D1 exceeded the downtrend resistance line. A number of technical analysis indicators have formed signals for further growth. We do not rule out a bullish movement if HK50 rises above its last high: 23640. This level can be used as an entry point. The initial risk limitation is possible below the Parabolic signal, 2 last lower fractals, the minimum since March 2020 and the lower Bollinger line: 22400. After opening a pending order, move the stop following the Bollinger and Parabolic signals to the next fractal minimum. Thus, we change the potential profit/loss ratio in our favor. The most cautious traders, after making a deal, can go to the four-hour chart and set a stop-loss, moving it in the direction of movement. If the price overcomes the stop level (22400) without activating the order (23640), it is recommended to delete the order: there are internal changes in the market that were not taken into account.
Fundamental Analysis of Indices - Hang Seng Index
The Caixin China Manufacturing Purchasing Managers Index rose above forecasts in December. Will the НК50 quotes continue to rise?
Caixin PMI in December 2021 peaked since June at 50.9 points. Caixin China Services Purchasing Managers Index in December also exceeded forecasts and reached 53.1 points. Note that over 12 months, the Hang Seng stock index fell by almost 17%. It lags behind the Japanese Nikkei (+ 6.3%), Korean KOSPI (0%) and the American (+ 25.3%). Important economic data for December is due out this week in China: inflation, New Yuan Loans and trade balance. They are able to influence the dynamics of the NK50.
