Hang Seng Index Technical Analysis Summary
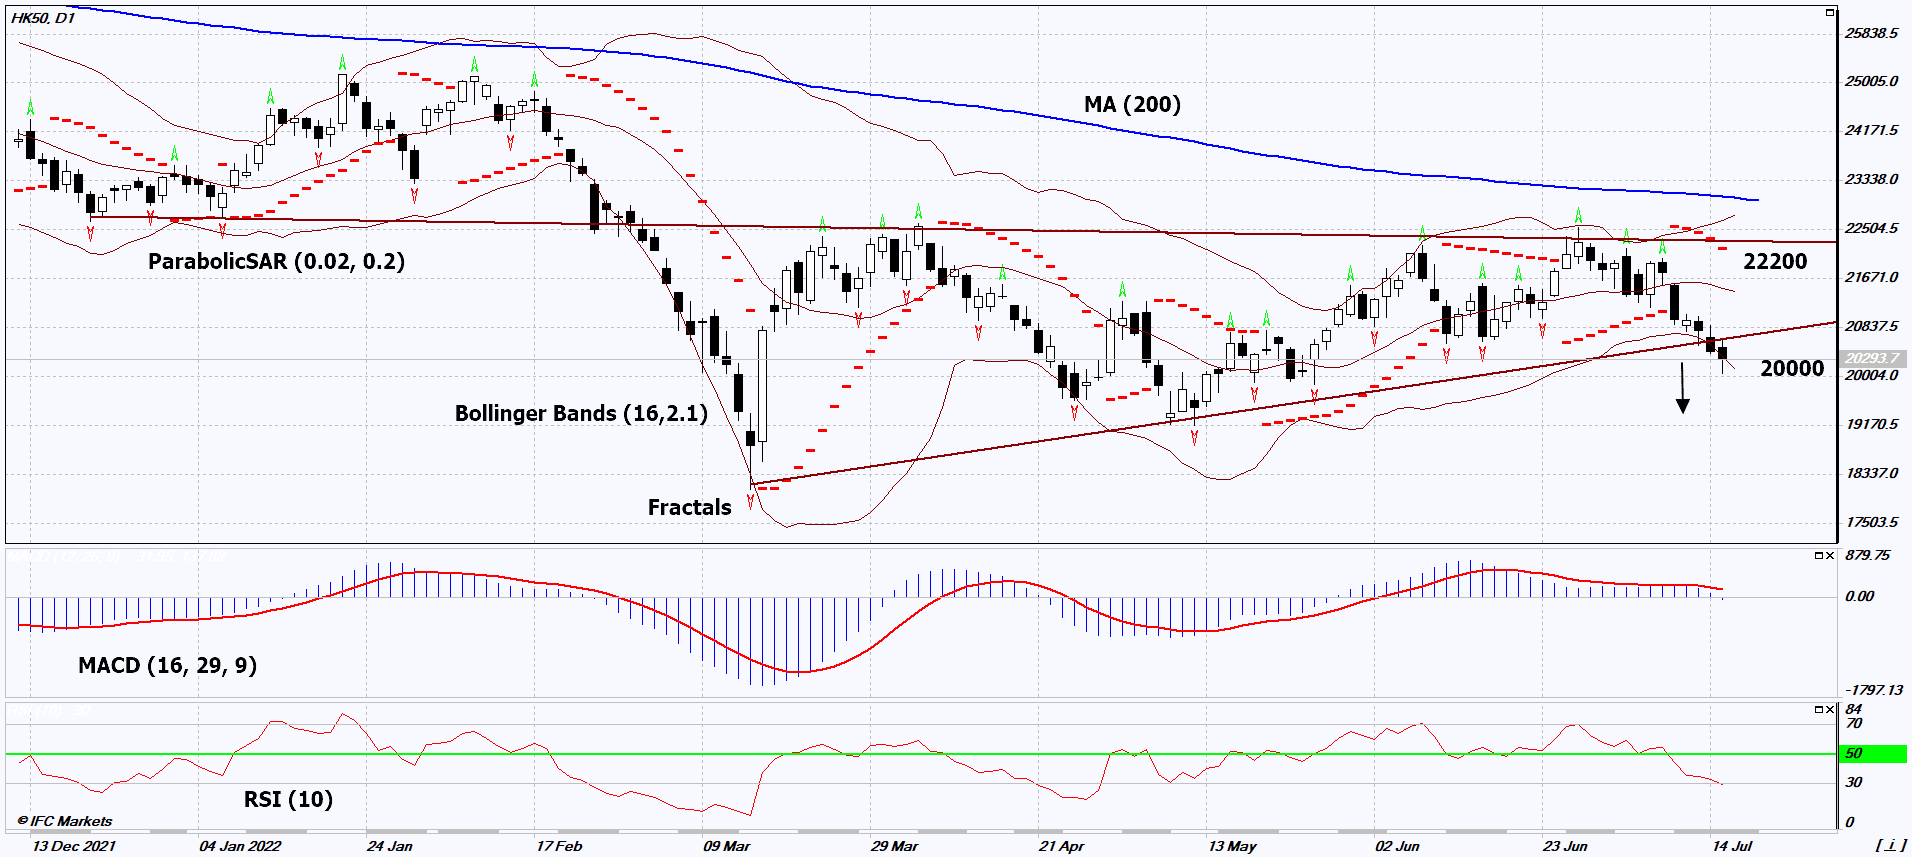
Sell Stop։ Below 20000
Stop Loss: Above 22200
| Indicator | Signal |
|---|---|
| RSI | Neutral |
| MACD | Sell |
| MA(200) | Neutral |
| Fractals | Sell |
| Parabolic SAR | Sell |
| Bollinger Bands | Sell |
Hang Seng Index Chart Analysis
Hang Seng Index Technical Analysis
On the daily timeframe, HK50: D1 went down from the triangle. A number of technical analysis indicators formed signals for further decline. We do not rule out a bearish movement if HK50: D1 falls below the last low and lower Bollinger band: 20000. This level can be used as an entry point. The initial risk limit may be higher than the last 2 upper fractals and the Parabolic signal: 22200. After opening a pending order, we move the stop following the Bollinger and Parabolic signals to the next fractal maximum. Thus, we change the potential profit/loss ratio in our favor. The most cautious traders after making a trade can switch to a four-hour chart and set a stop loss, moving it in the direction of movement. If the price overcomes the stop level (22200) without activating the order (20000), it is recommended to delete the order: there are internal changes in the market that were not taken into account.
Fundamental Analysis of Indices - Hang Seng Index
China’s GDP turned out to be worse than expected. Will the correction of HK50 quotes continue?
Chinese GDP in the 2nd quarter of this year decreased by -2.6% q/q. Investors expected it to grow by 1.6%. Recall that since the 90s of the last century, a quarterly drop in China’s GDP was observed only in the 1st quarter of 2020 (-6.8% q/q) at the height of the coronavirus lockdown. In annual terms, GDP increased by +0.4% y/y. This is also worse than the forecast +5.3% y/y. China Gross Domestic Product Year to Date (according to the results of the 1st half of 2022) amounted to +2.5%. In the same period in 2021, it was +12.7%. Theoretically, this allows us to predict that by the end of 2022, the Chinese economy will still continue to grow. The last time its annual decline was observed in 1976 (-1.6%). However, economic risks could have a negative impact on Chinese stocks.