Hard Red Winter Wheat is one of the grain commodities, along with soft red wheat, corn, soybeans and others. Within the wheat family, first of all, there is a fundamental difference between two wheat types. Soft wheat is low in protein and is basically used in cakes in pastries. By contrast, hard wheat has a higher content of protein and it founds itself in breads and hard baked goods. Some time ago, trading of hard wheat took place at Kansas City Board of Trade. Then, it moved to Chicago. One can trade hard wheat futures at Chicago Board of Trade under the ticker $KE. Hereby, the contract size is 5’000 bushels (300’000 pounds) each and the prices are in Dollars US per 100 bushel.
We saw prices climbed from 524 USD in December 2020 towards 738 USD by August 2021. There, we have forecasted a rally towards 1’000 USD and higher to take place. In May 2022, hard red winter wheat has printed a highest price since a good decade at 1225. Then, we saw a short term pullback taking place. We have proposed a correction as an expanded flat structure against August 2019 lows. As a matter of fact, pullback took a larger scale and the market is correcting against October 2016 lows as an Elliott wave zigzag pattern. We will discuss the wave structure, support area and the targets.
Hard Red Winter Wheat Weekly Elliott Wave Analysis 11.20.2023
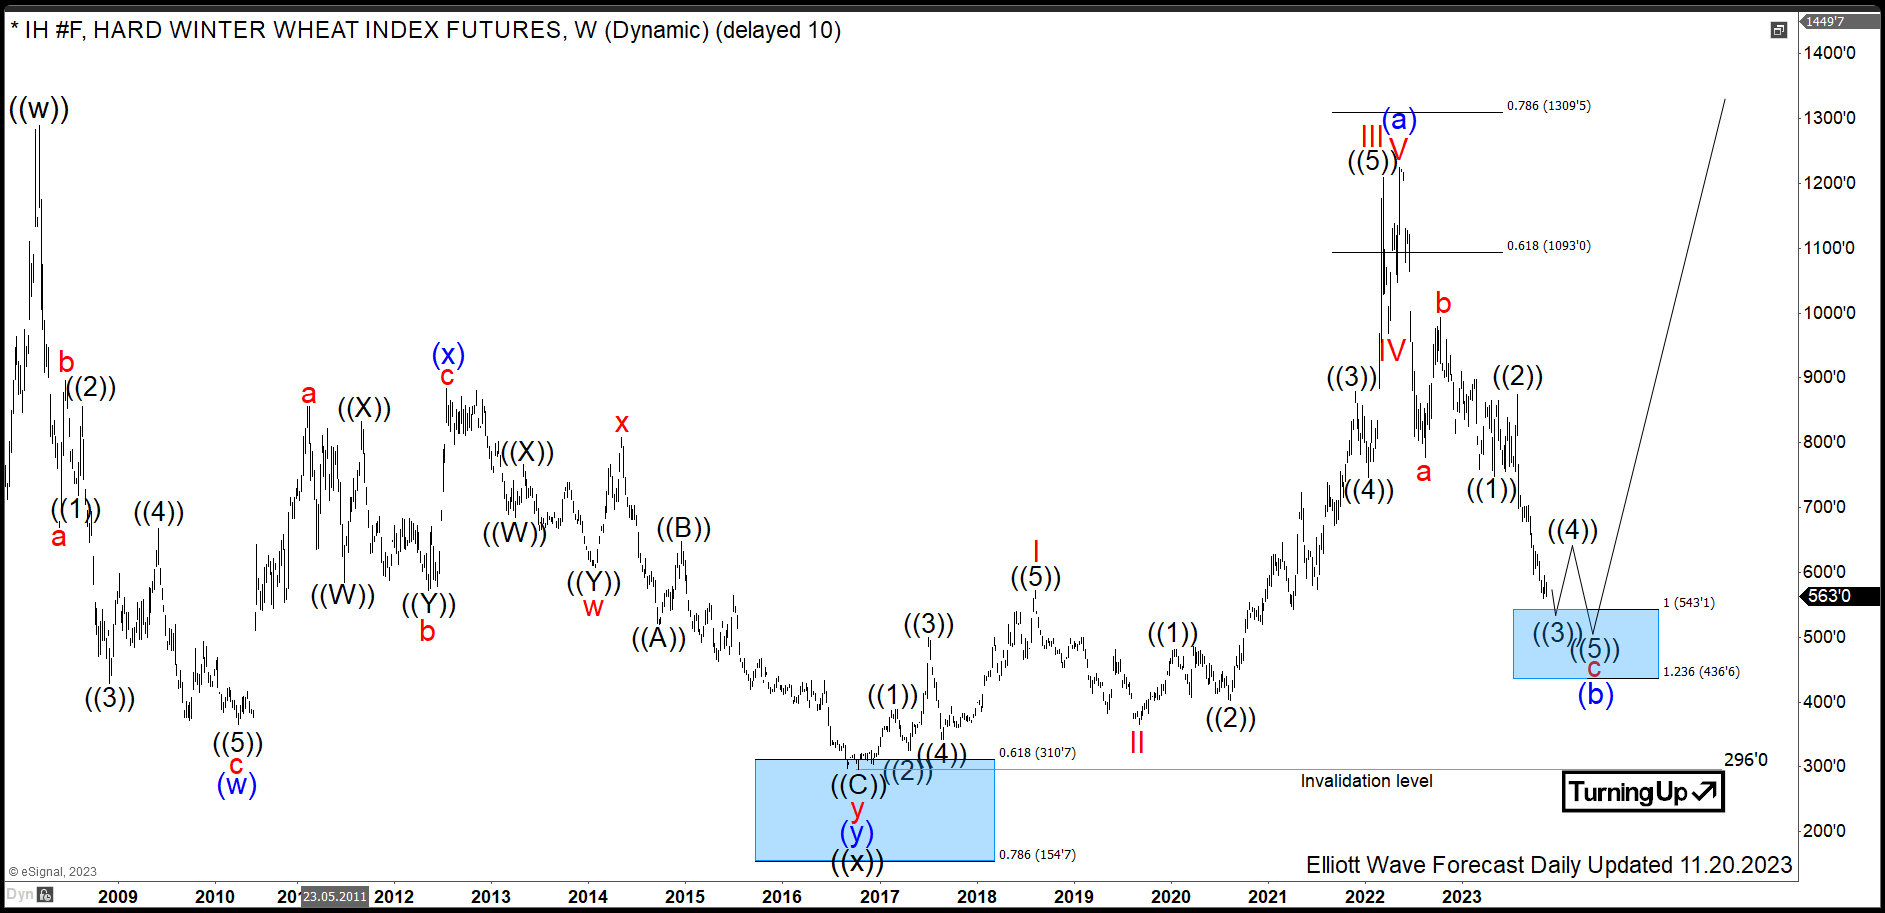
The weekly chart below shows the Hard Winter Wheat front contract IH #F. From the all-time lows, the prices have developed a cycle higher in black wave ((w)) of a grand super cycle degree. It has ended in March 2008 at 1290 Dollars. From the highs, a correction lower in wave ((x)) has unfolded as an Elliott Wave double three pattern. In only 8 years, in fact, IH #F has lost more than 3/4 of the price reaching 296 Dollars per 100 bushel. It is the preferred view that an important bottom on October 2016 has been set and the black wave ((x)) has ended.
From the lows, consequently, a new rally within black wave ((y)) has started. Similarly to the wave ((w)), wave ((y)) should see 3 swings up. Hereby, 1st swing within the super cycle degree wave (a) has already ended. It has reached 0.618-0.786 multiples of the wave ((w)). Now, pullback in wave (b) should find support in 3, 7 swings against October 2016 lows. Then, final push higher in the 3rd swing as blue wave (c) of black wave ((y)) should take place targeting 1585-2382 area.
From the October 2016 lows, blue wave (a) demonstrates a textbook quality impulse. In fact, red wave III shows an extension beyond 2.618x of the wave I. Indeed, extension is a characteristic feature of impulsive waves. Blue wave (a) has printed a top in May 2022 at $1225. From the highs, consolidation in blue wave (b) is taking place. Firstly, red wave a has printed a low in August 2022 at 777. Secondly, bounce in red wave b has set a connector in October 2022 at 923 highs. Thirdly, price has broken 777 lows opening up a bearish sequence. Now, red wave c should reach 543-296 area.
Investors and traders can be looking to buy IH #F ($KE) from 543-296 area. For 2024-2030, the expectations are to break to the new all-time highs. The long-term target for wave (c) to end will be 1585-2382 area.