The world largest home improvement retailer Home Depot (NYSE: HD) sales growth doubled its pace from the prior quarter despite reduced operating hours and cancelled promotions because of the COVID-19 pandemic which pressured most of the retail industry.
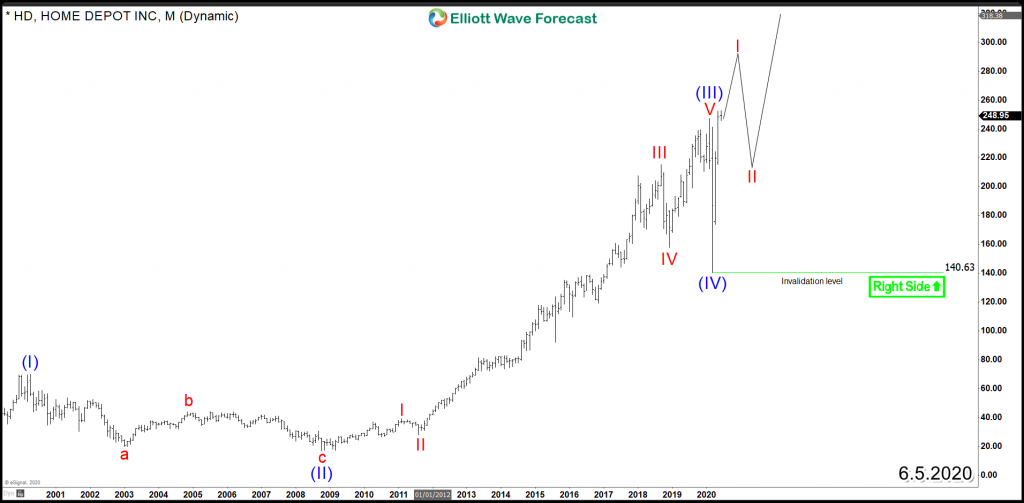
Early this year, HD ended the cycle from 2008 low and did a sharp 40% drop along side the rest of the market. The decline didn’t last long as the stock managed to recover the loss and it’s currently up 13.3% year-to-date. If we take a look at the Elliott Wave structure within the monthly chart, HD is showing an impulsive advance from all time lows and the recent break into new all time highs puts the stock with the minimum amount of swings for a 5 waves move.
Home Depot (HD) Monthly Elliott Wave Chart
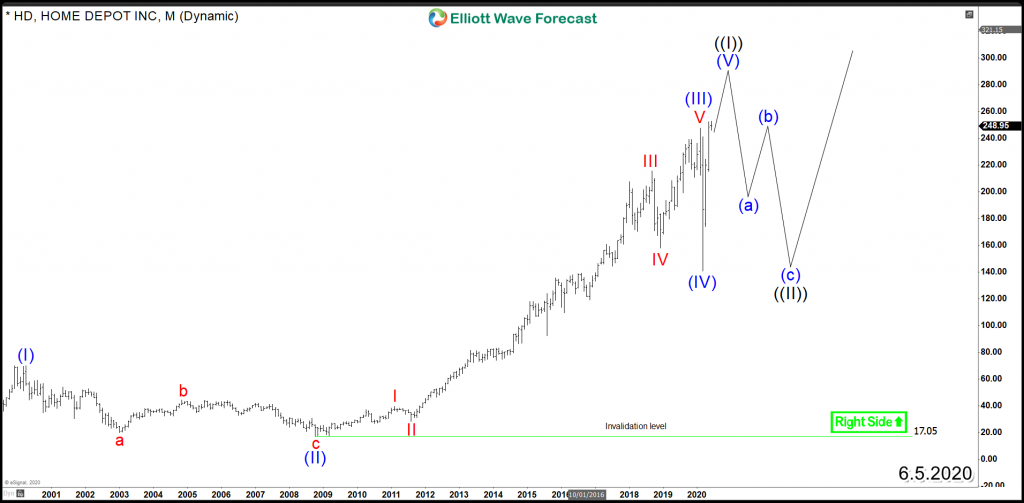
The long term trend for HD remains bullish based on the impulsive structure but the pressure is mounting as the stock is entering the stage where it will define the main path : either an Elliott Wave extension within wave (V) of the super cycle to take place or the stock is ending the Grand super cycle.
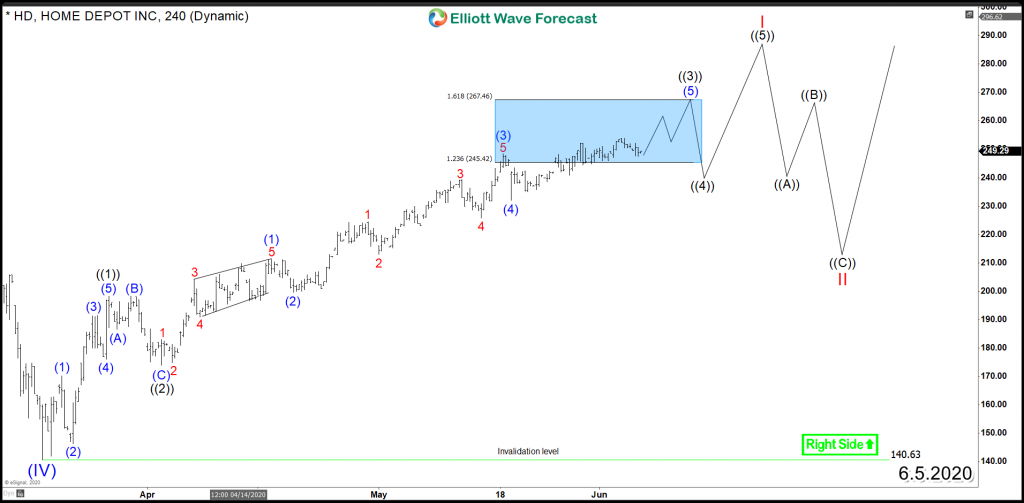
The 4 Hour rally from March 2020 low remains in progress but as the stock is entering the extreme area $245 - $267 then the risk is becoming higher for Longs which still can aim for the 200% Fib extension area $289 if the bulls sustain the trend.
When the current cycle in wave I ends, HD will be looking to correct it in 3, 7 or 11 swings in wave II which will take place during this summer. The key level for the pullback will be 3/18 low $140.63 as the stock is expected to remain supported above it and buyers are expected to show up for the next Long opportunity.


