BIO:
I started following the markets in 2000 when I was 13 years old, tracking the stocks my father bought for me. In 2015, I closed my previous business and turned to professional trading. Between 2015 and 2020, I held nearly 90 seminars and training sessions. However, the money I’ve earned from 2020 to 2024 far exceeds what I earned between 2015 and 2020. Especially in the last two years, I’ve seen much better profits. I now realize that the money I made in the past wasn’t truly significant. I believe it’s important to share this realization with you, especially with those who still have hope and need to succeed.
As part of my faith, I believe that knowledge comes with a responsibility to share it, which is why I’m offering this strategy to you for free. You can apply this strategy manually, but if you prefer, there is also software that highlights these breakouts. I may charge a fee for the software on behalf of the developer, though I haven’t yet discussed the cost with him. However, you can easily follow and apply this strategy manually without needing any software.
[Edited for Forums Policy violation]
TMT ISTANBUL STRATEGY:
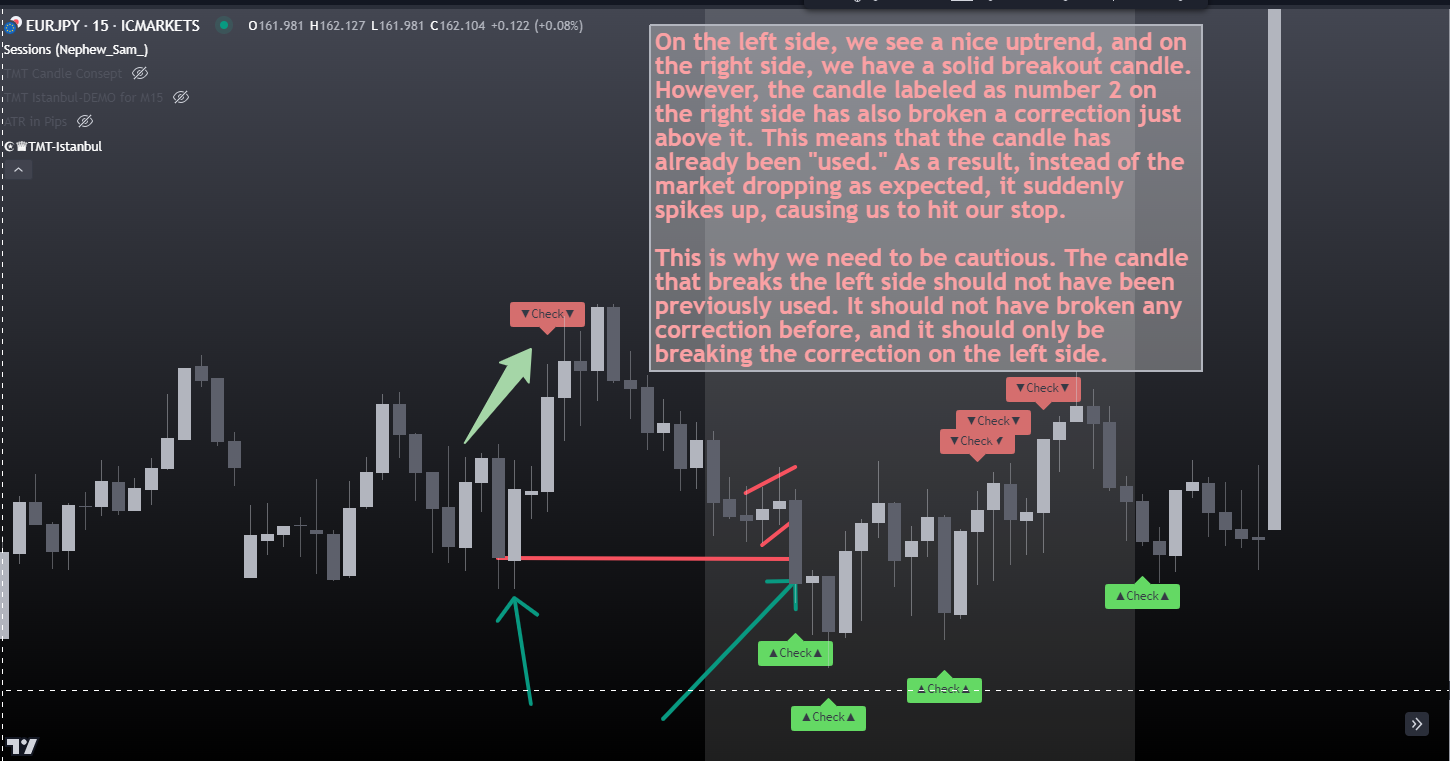
In my TMT Istanbul strategy, we look for a breakout on the left side of the chart. If there is an uptrend or downtrend on the left side, we focus on the breakouts of the corrections within that trend. These corrections on the left side can be single-candle corrections or multi-candle corrections.
The candle on the right side that breaks the correction on the left should not have broken any correction within its own trend and should be a clean candle that hasn’t previously broken any significant level.
If a candle breaks a correction while simultaneously breaking a correction on the left side, this trade usually either reverses before reaching its target and hits the stop, or it gets stopped out without ever reaching the target.
Therefore, we need to ensure that the candle on the right side only breaks the correction on the left.
As a second step, as soon as the right-side candle breaks the correction on the left, a correction should immediately begin—without even one candle of delay. Once this correction is broken, we can enter the trade, effectively catching the trend right from its beginning.
EXAMPLES:
Now, I’ll show you on the chart and provide examples for both a downtrend and an uptrend. Additionally, I’ll demonstrate a situation where the right-side candle breaks both the correction on the left side and within its own trend, leading to a stop-out. After that, I’ll explain how we determine the entry, stop-loss, and take-profit levels for trades.


Now, I’ll show you the effects of an unwanted breakout—where a candle breaks both the correction and the left side at the same time.
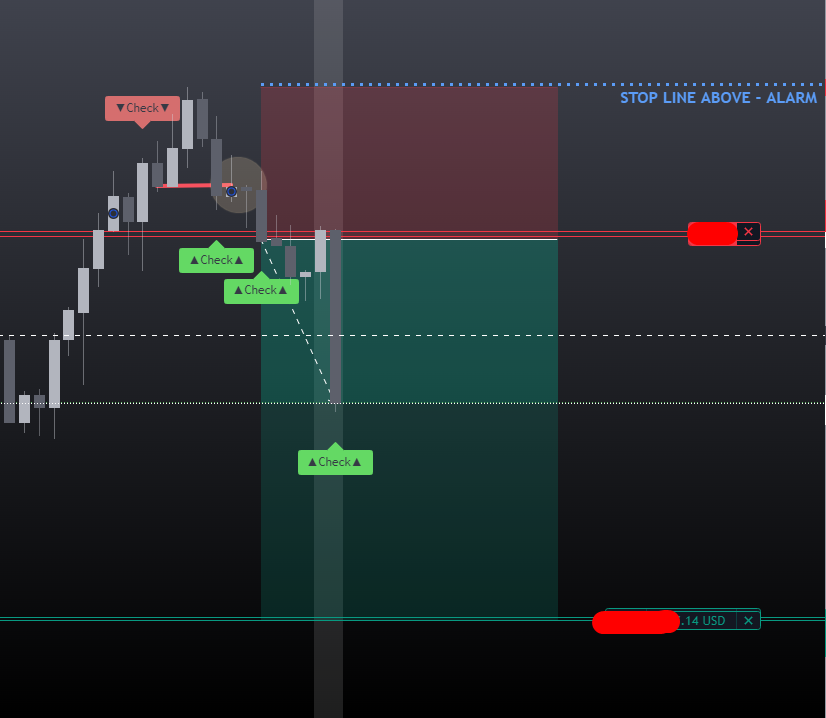
STOP LOSS & Take PROFIT
It will be easier to show an example of stop loss and take profit using my own open trade. I prefer using a previous significant low or high for my stop loss, and I close my trade 2 hours before U.S. data releases. I remove my stop loss level and close the trade if a candle closes above that level. This way, I avoid being stopped out by the wicks of a candle.
For take profit, my closing time is important. I close my trade 2 hours before U.S. data releases, which is 1:30 PM UTC+3.
Finally, I’d like to make a few reminders:
a) TMT Istanbul works on all financial instruments.
b) We find the best breakouts on the M15 chart interval.
c) The correction on the left side can consist of 1 candle or 20 candles.
d) The correction following the breakout candle on the right side can also consist of 1 candle or 20 candles.
e) The candle that breaks the left side must immediately start a correction on the right. If there’s even a 1-candle delay, the setup is invalidated.
f) Do not enter a trade until the correction on the right side is broken.
g) There are about 15 trend reversals in a day, allowing for multiple trades.
h) Trading Sessions: I trade between 06:00-13:30 and 15:45-18:00 UTC+3.
----TMT----
x) It has a very high success rate. Remember to manage your risk.
Good Luck everybody.
TMT