This^^^
Price moves up and down, for the most part, in all time frames. In an uptrend, price is forming higher highs and higher lows. In a downtrend, price is forming lower lows and lower highs. I’m sure this is explained in detail through the links posted by @SchmaltzHerring.
A long-term trend on the daily or weekly chart is more likely to continue, than to reverse.
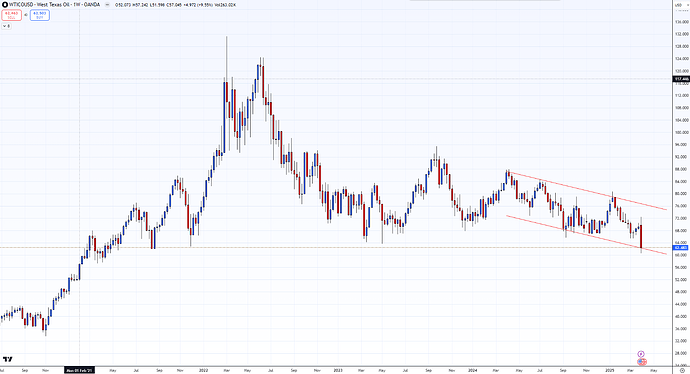
As a visual, I like to draw channels to represent a current trend…
Oil weekly chart:
GBPUSD Daily chart:
EURJPY daily chart:
GBPJPY 4H chart:
That’s usually as low as I go for TA, but you get the picture.
Remember that these are just rough lines on a chart, a visual for guidance. The market doesn’t see them because they’re not really there, so don’t assume price will respect them, just like what happened in the last chart. It’s a game of probabilities, and EURJPY will probably continue lower, based on recent price action. But, that’s just my personal opinion, based on my analysis. Someone else will look at that chart and say “no, it’s clearly at a major support level and is headed up”, in which case they’d probably be right and I’m getting stopped out.
Learning to read price action is a skill that takes time and practice, but it’s a valuable skill once you’ve mastered it.
Good luck.


