For those who use Bollinger Band on their Chart, one of the difficult part of this great indicator is to read correctly what will happen at the middle BB which is the 20 days moving average. Here the price seems to be neutral, not showing clearly if the price will go up or break the middle band.The middle band is usually at a resistance or support depending on where the price is coming from.At this level the price can range, that is oscillate for some time before taking direction.Some call this period ,indecision period, indeed this is what it is., hereafter the price can go in any direction.
SOLUTION There are so many other ways others can trade this level but here is how I trade this level successfully after many years of observing this level.In an uptrend if the price falls from a resistance and gets to the middle BB, for example in a 30minutes chart, the first thing I will do is to check if there is a support level at either the hourly or 4hourly chart.If no, then I will get my signal from the lower time frames,eg, 5min ,15minutes or even 1minute chart.If the lower time frames shows weakness, then I know that this support level will be broken.The other way round ,in an uptrend too ,if the lower time frames here shows sign of recovery, for instance if their stochastics is in the overbought positions ,chances are the support in the 30 minute chart will bounce…This same principle works in other time frames.
Lest I forget, if there is a support level in the hourly or four hourly chart, there is a greater chance that the price will bounce most of the times.We all know that trends in the lower time frames respect trends in higher time frames.
Next I will write on Bollinger Band Strategy still
Thank you for reading, I also expect your comments.
I’ve tried using BB many times but don’t find them very reliable on their own. I do however find the middle line, which of course is the 20MA, useful, especially in a trend on the 4H or 1D charts as entry triggers.
Here are a couple examples:
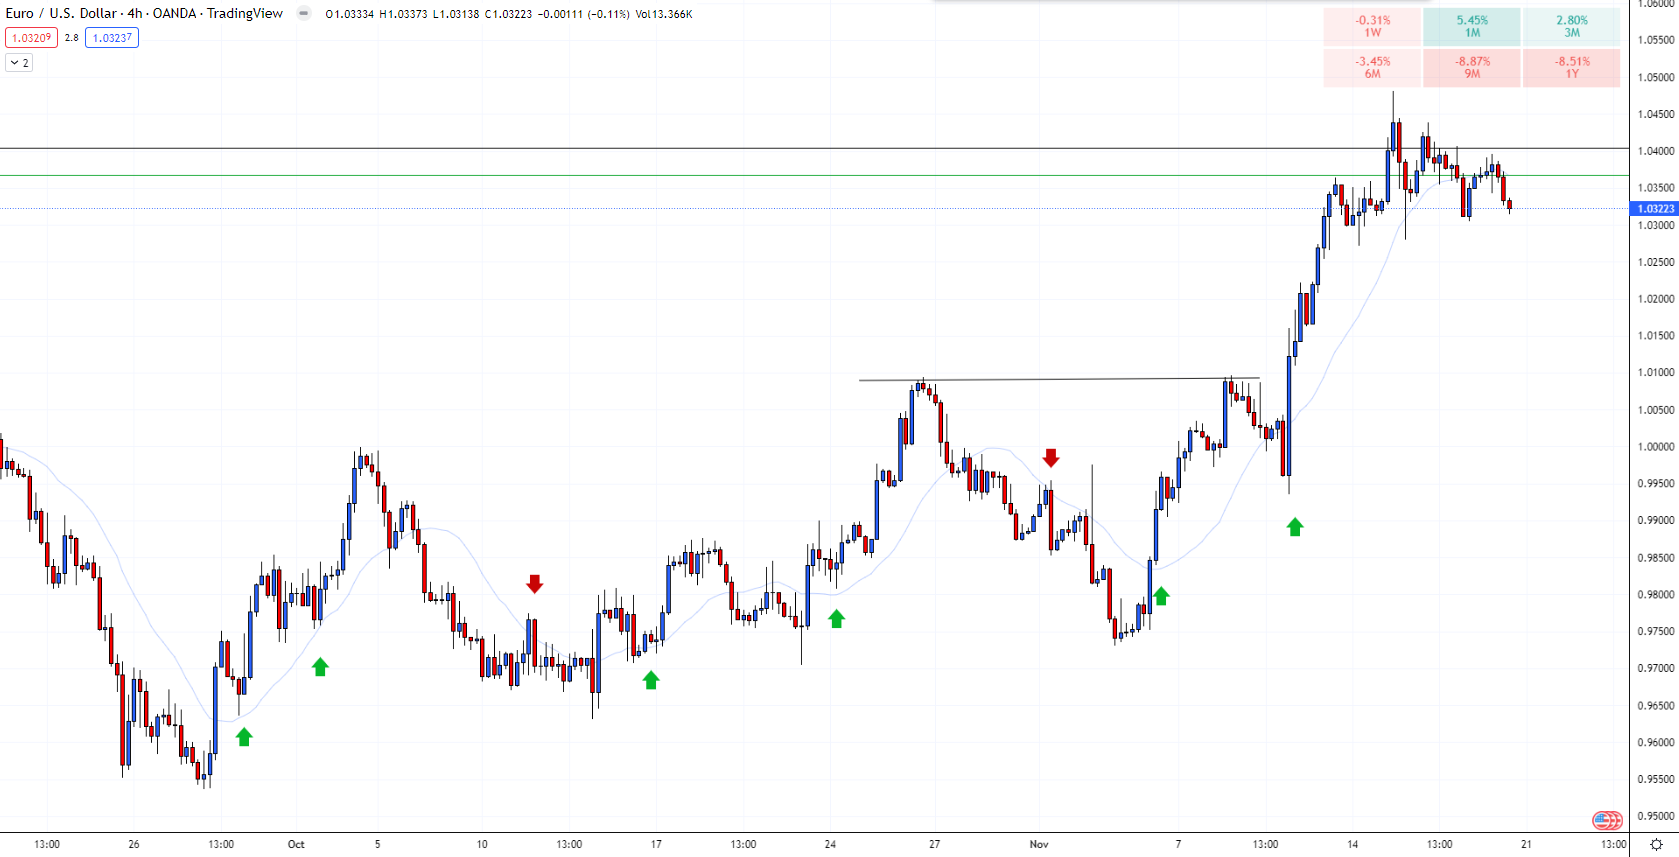
4H - Entry triggers using 20MA break and retest as well as rejection off the 20MA WITH the 20MA trend only:
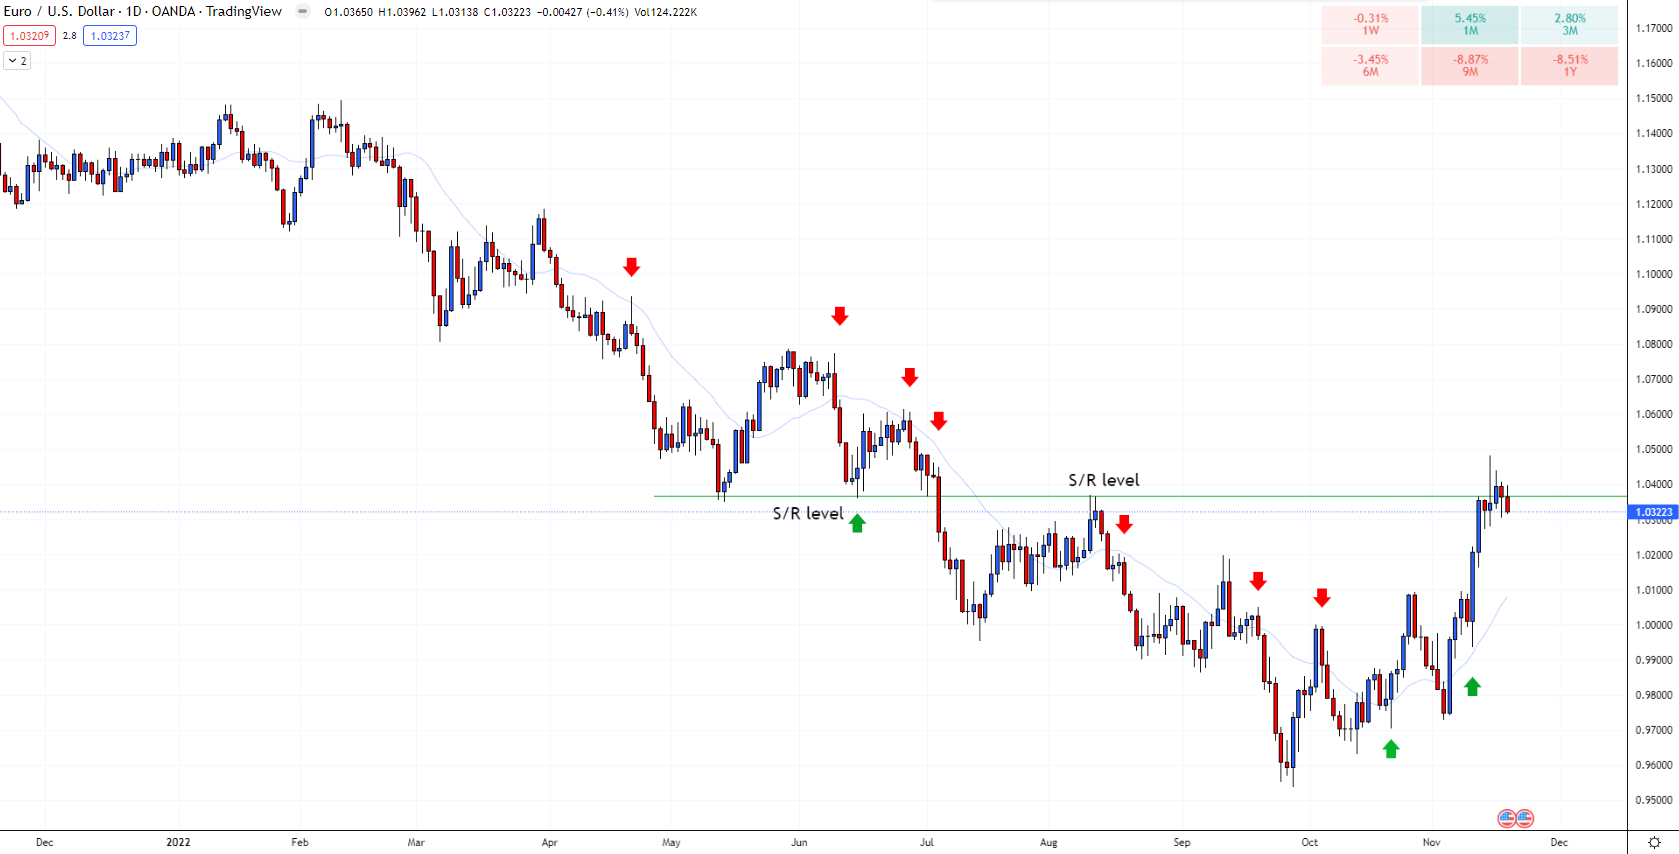
1D - Same basic concept of the 4H chart; with the trend only. Not as many opportunities, but more reliable, especially if you factor in S/R levels and candle patterns such as an engulfing candle:
Again, this no longer really has much to do with BB except for the middle line, on higher TF’s. So my apologies if I’ve taken this topic off course.
We have a common ground on 20dma.You said that it helps to trigger entry, which is very correct. Bit aim of this monograph is not to capture everything about Bollinger Band Strategy, but just how to know if the middle BB will bounce or break. There is a lot to learn about this strategy and if done correctly will help a trader to be consistently profitable.
Than you for your comment.
You can’t know that. This is just a line from an indicator that overlays the chart based on the past 20 candles. The market doesn’t care about this line, it doesn’t really even exist.
But you take this line and factor in everything around it like, trend direction & S/R levels, then you’re seeing the whole picture, or price action. Once you’re able to see that then you don’t even need this line, it become obsolete, like most other indicators.