How to NOT trust (follow) the given situation

Hello,

I’m kindly asking if someone could please tell me with advice what else, which additional step, should I integrate in my strategy. Image file is attached - please look at it.

I’m looking for additional part of the strategy where I could get the answer that would tell me something like this: ‘‘Even if current situation is looking good to open downtrend position, do NOT open it yet’’

The purpose is to get some warning that everything might not be so good as it looks like but I’m asking you for some help please, what else should I do to get such informaiton from the task I’m asking for.

So far my normal procedure, when I get an alert on H1, looks similar to this (note: my message has no relation to criteria when alert is shown and when not so I will exclude this otherwise only this criteria, which is automated by my tool, consist of around 8 additional steps - I’m EXCLUDING all those from below steps):

Step1: Direction of a trend must match the alert on H1.
Step2: Direction of a trend must match the alert on M30.
Step3: Making sure there is no ranging market neither on H1, nor on M30 nor on H4.
Step4 (relevant only for H1): IF BUY Position: No larger size of upper shadow of latest closed candle on the price level where bearish retracement(s) has/have recently happened where trend was already forming large size of upper shadows. IF SELL Position: No larger size of lower shadow of latest closed candle on the price level where bullish retracement(s) has/have recently happened where trend was already forming large size of lower shadows.
Step5 (relevant for H1 and M30): IF BUY: As small as possible upper shadow of latest closed candle indicating continuation of (potentially strong) bullish momentum. IF SELL: As small as possible lower shadow of latest closed candle indicating continuation of (potentially strong) bearish momentum.
Step 6 (relevant only for H4): Direction of a trend must match the alert on H4.
Step 7 (relevant only for H4): IF BUY: Latest closed candle must be bullish. IF SELL: Latest closed candle must be bearish.
Step 8 (relevant only for H4): latest closed candle should NOT be indecision (allowed exception which is otherwise required as stated in step 9: accuracy when it comes to lower highs [IF SELL] or accuracy when it comes to higher lows [IF BUY])
Step 9 (relevant only for H4): Previously stated accuracy.

So my work consist of those steps, several even more important steps of background functionality depending on whether or not the alerts will be shown and several YEARS of development work (not by me personally) for creation of unique MT4 EA tools.

However in the purple color text of attached image, nothing works. Whatever I do, nothing works and I really need your help.

Unfortunately the crucial importance of Step5 lost the logic in the background of analysis. There is extremely small lower shadow (in fact, none!!!) on both H1 and M30 as you see on image but retracement still happened.

I have already considered the following 7 approaches that are all pointless to be implemented so I’m NOT asking for them (I already thought about them) but something else, something by far more accurate and better because approaches below could lose very good chances of making profit:

Approach 1:

Usage of economic calendar. Some result of news event could cause trend retracement in unwanted direction. Sometimes those even high impact events don’t really move the trend directions which means complete nonsense and waste of opportunity. Sometimes news events could push the trend towards wanted (matching opened position) direction. So considering economic calendar for exact time as result of event is posted is not a good idea.

Aproach 2:

I don’t want to use lower than M30 time frames or higher than H4. Reason for lower than M30: not enough accuracy (reliability). Reason for higher than H4: too few opportunities.

Approach 3:

Please look at attached image file at purple color case (the main problem). See bearish candle on H1 that opened at 20:00 so the one before the purple circle located at around the center of entire image file. Do you see that 20:00 bearish candle? Look at closure price. You can see a clear Support zone. I will not use such Support/Resistance zones analysis in such way because there are hundreds of them and trend is usually entirely disrespecting them. I need your by far more accurate advice please what to do so I would REFRAIN from opening downtrend position.

Approach 4:

Please look at attached image at purple color case, right-side TOP graphic saying ‘‘H4 situation’’. Do you see the purple circle? I mean the purple circle at the top right side near ‘‘h4 situation’’? There is no need for H4 (reason: alerts are based on H1 as main time frame) that LOWER shadow of latest closed candle (circled one) would be below the lower shadow of previous candle.

Approach 5:

I don’t want to use any MT4 indicators, particularly not default ones. Indicators are showing past and current situation. There is no reliability that near-by future (e.g. next few hours) will be the same.

Approach 6:

Hedging is for very obvious reason out of question. I need something that PREVENTS me from opening bearish momentum because of disaster that follows at 21:00.

Approach 7:

Websites such as Investing dot com and similar ones, searching for currency pair and checking there graphical arrow. Reason: Updates of those graphical arrows are having by far too high delays. When retracements really happen, arrows stays from previous momentum. When momentums are coming to an end, arrows on such website have zero effects. Very poor updates. I’m usually referring to arrows where % is also given. Try to open investing dot com website and do your search for random currency pair and you will see what I’m referring to.

So all those 7 ideas are poor. I thought about them and they won’t solve the problem.

What else can I do please?

Thank you!

Again another situation, same issue. At 0:00 broker time (opening of this candle), I’m looking for something that would indicate like ‘‘Hey don’t open downtrend position, at least not yet’’

Look what happened at H1. Even comparison of body sizes won’t work here.

Even the smallest retracements are deadly for small balance accounts.

Your approach sounds very rational.

Immediately I would say I like to use as few criteria as possible, no more than 3. I like the criteria to be objective, so e.g. price is either above or below, there is no in-between, and no judgement is required.

I never enter live, always via pre-set order.

And if really unsure, there is always the option to set opposing buy and sell entry orders.

1 Like

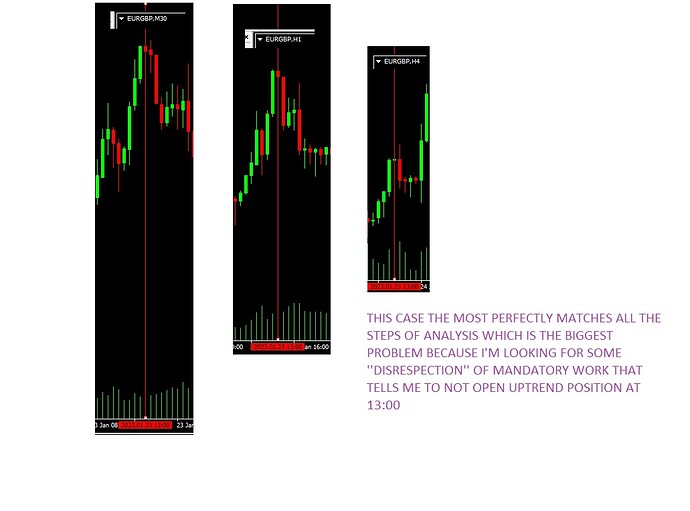
I am attaching 5 extra cases of the problems where I’m looking for advice what to do to NOT trust the current good looking situation.

One possible solution, as you tommor said, is doing the pending order first and I have complex tool for that too - the tool that opens two pending orders, one in BUY one in SELL direction and that tool is working with yet another related tool which is doing complex analysis and then I manually set up restriction, based on third tool (alerting tool + my manual work), which exact position (buy or sell) must be executed, otherwise the position (if unwanted gets executed) gets immediately closed while still being on Demo MT4 account so before automated transmission to another MT4 terminal running Live account. Massive amount of features are integrated. However, no matter what I do, I’m keep getting my balances burnt out on account because of the problems I’m describing and pending orders, instead of marker (live) orders, won’t always help here because of multiple problems that may occur with sized shadows (tails).before the retracement happen.

Could anyone please check attached files and tell me what else could I do? Symbols and cases are chosen completely randomly. It could be anything else.

CASE3

CASE5

CASE6

Short time-frame candles have many crazy long wicks, and the ratio between the ranges of candles can be very high.

Long time-frame candles have few long wicks, these are shorter in relation to the candle bodies and the variation in candle ranges is not so extreme.

To be honest, no indicators would give you that, you figure it out yourself. But i won’t just tell you “figure it out” without giving you a clue, because i was once in your shoe. I promise to find you a pdf from my computer and share it with you, probably this week. But before that, i will say the candles are not enough.
All of your approaches are quite good, you might reconsider some if not all.

@tommor I know what you said but this doesn’t anyhow help me to NOT open the trade when the the situation I described in few cases looks good. What else could I do?

@ayodimej1 please kindly read again my first message. So called ‘‘approaches’’ (7 + additional 8th in my second message) are useless and definitely not good. They do not anyhow help me with solution that I’m looking for. Steps are good yes but not approaches. ‘‘Steps’’ and ‘‘approaches’’ are two different subjects. If candles are not enough, what else should I do? My tools were under development for years and they are high quality but every time I seem to be missing something that burns ENTIRE balance on my account.

Both of you and everyone else: In my previous message, I showed 5 additional cases of this problem. I found the solution for 3rd, 4th and 5th case and I’m showing a solution for 5th case only (H4 only) but the solution does not work for 1st and 2nd case and I’m asking once again for help on this please. What I found out after further investigation is the following and perhaps you might want to compare this image with the last image of my previous message because it’s identical case (clarification for case5 only from my previous message):

Are you sure you’re on the right road? I’m wondering if the only way you might get the very specific answer you need is if someone else is on the same route, but it looks like a very lonely road to me.

1 Like

It looks to me your analysis are purely price action; but if i can get you right your question not wanting to catch a fake reversal in a strong trend?
Moreso, i could see your understanding of price action is still at a basic level if am right.

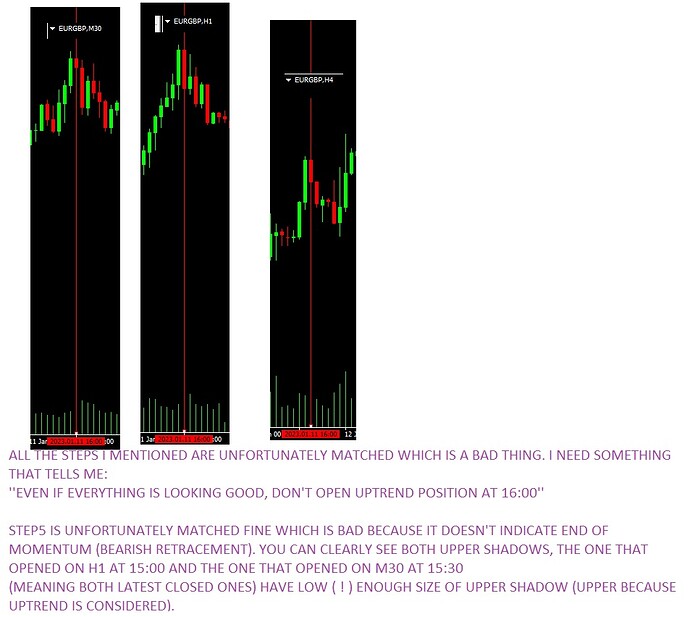
Another case is attached so I can show exactly with more situations what the issue is. I would love to meet a genius who would NOT open uptrend position here. Being informed ‘‘Why’’ such decision is exactly what I’m looking for but remember to ignore useless approaches listed in my first message (not steps but approaches!). All of the steps (i repeat, steps and NOT unwanted approaches) that I listed in my first message unfortunately match.

Even worse: additional two steps:

  • sufficient body size [meaning not the smallest out of most recently closed 3 candles]

  • observation of upper/lower shadow (it’s upper in this screenshot) being above/beyond (it’s ‘‘above’’ requirement in this screenshot) areal (regional) high/low of a shadow (what I mean with ‘‘areal (regional)’’ is explained in previous message). If closes above/below then continuation is expected so position can be opened. If not, I should refrain myself from opening the position I’m considering.

match too. So I really need something what will NOT match the steps so the step gets disrespected, meaning I should not proceed with opening of position.

I lost for fourth consecutive time ENTIRE BALANCE on account and I have no income so you can imagine the problem I’m in is the worst of the worst.

@tommor I’m sure the steps I’m doing are valid but no, I’m NOT sure the ‘‘road’’ is right. It might be entirely wrong. I’m only saying that from theoretical aspect the steps I’m doing, as described in first message, are really belonging to valid verification of trend but there is something major here that I might be missing. It might be something basic.

@ayodimej1 See unwanted Approach 5 (to be ignored) from first message. As stated on multiple screenshots, my question is what extra step(s) do I have to take so after doing that extra step, I will find out an information (an answer) on my own that looks like ‘‘Do NOT open position in this direction even if all the steps match correctly because retracement will follow extremely soon’’ The problem is that all the steps I’m working on are happening (matching) successfully and I need something to fail. I need failures from the steps so something will get disrespected and will inform me to not open position. It’s very hard (currently impossible for me that’s why I’m asking for help please) to find those failures (disrespection of steps) so I’m asking what more can I do to get the failure so I won’t open position in such situations.

1 Like

@YourFriend0 here’s the pdf i was talking about. It was a big file i had to compress it.
The Ultimate Guide To Price Action Trading - Rayner Teo-min.pdf (2.1 MB)

Give this book a read and remember to feed me back if it answers your questions or not. We would figure out what need to be done after.

@ayodimej1 Thank you for that. I entirely reviewed what you sent, all 58 pages.

Honestly as soon as I saw on page 8 S/R zones, I wanted to stop reading because I firstly considered it as nonsense due to the fact that this is related to unwanted Approach 3, defined in my first message. There are hundreds of such S/R zones where either consecutive shadows are occuring or clear retracement from one large shadow. It’s impossible to know (at least for me) which one to consider. Besides that, in large majority of times trends are completely disrespecting S/R zones. There is also another problem with S/R zones: A) Candle could fail to touch it either with shadow or with body which may or may not indicate a retracement and there is no way to get this as an information to refrain from opening a position (remember please: my primary question is related to refraining elements), B) either body or shadow could only touch but not cross the zone. If this happens multiple times on consecutive candles then this might be helpful to NOT open position which is exactly what I’m looking for but due to variety of reasons even this won’t work because I need something on the FIRST produced alert that leads to NOT opening position. Consecutive only touches would mean that I have to, after first alert, keep checking whether there is any additional ‘‘touch only’’ by either body or shadow. Definitely out of question because when there is first touch only, this doesn’t yet mean retracement will occur so doesn’t yet push me away from opening a position. I could get an alert upon first touch only, C) fake breakout by shadow which is probably the most accurate subject of A/B/C since this clearly tells me to not open the trade but again, the problem is that I can’t know which S/R to use, there are too many, D) closure of bullish/bearish candle beyond (above/below) the zone which could do right the opposite: encourage me open the trade. I’m having good S/R tool it’s converted version of BarryQ - using lines instead of dots that show me where S/R but trend is in large majority of times disrespecting those zones. They could be anywhere. Nobody knows where retracements will reallly happen. It’s a bad idea.

I have been doing many notes like that in the past.

Regarding page 11: Please kindly see unwanted approach 5 in my first post. As soon as I saw indicators (MA), I knew it’s a terrible idea. Indicators are showing what has happened in the past and what is currently happening. There is zero reliability that the situation in the near future will be the same.

Page 12:This is more interesting and looks more trustworthy to rely on but only if trader has high balance on account. I don’t and I’m looking for solutions to NOT open the trade before corrective move happens. So what I’m trying to find out is how to NOT open position before it goes into corrective move assuming that alert is towards impulse move.

Page 20 (I’m commenting only Structure Of The Markets section): Again, interesting to consider because I’m usually not doing exactly what the image on page 20 (I’m obviously referring to the second image) is showing. Instead, I’m checking shadows’ highs/lows on consecutive candles and not by areas. Could this be a mistake? The reason why I’m not verifying them by areas is because I need current situation on the market and not large historical one. Current situation will more accurately tell me what is most likely to happen in the next few moments (e.g. hours). Besides that, if I was doing what is on that image then I would not know which shadows within area to pick. Probably the ones within particular range (price vertical difference between two points) but there are multiple ones and it’s a big doubt what exactly to group together into a range. Comparing the image on page 20 with the screenshots I was reporting, this wouldn’t anyhow help me. No need to comment further.

Page 27: I’m understanding from this page that the more the trend is coming to a range (flatter trend), the more chance for retracement is and consequently the more stronger information that I must NOT follow an alert I receive to open position. The problem is that very often retracements happen without prior occurance of ranging market (more flatter trend than it had been prior to that). One such situation is shown on ATTACHED IMAGE file below. You can see there wasn’t any ranging trend (the trend getting less steeper = more flatter). at 18:00 on H1 If I analyzed only H1 time frame, there is no chance to estimate what do do because of two reasons that I’m showing on image file in purple (please pay attention to purple!) color. However, appropriate solution is shown with brown color on H4 which works good, although I stil don’t understand how could I rely on something that happened around four hours ago (it’s H4 time frame) but it works fine so see brown color text for that.

Page 28: I believe there is a mistake in upper image. The bodies are getting smaller on corrective and not impulsive moves because corrective ones show potential ranging market. Am I wrong? Smaller the body size is, larger the chance for retracement is. However, problem is the following: First smaller body would occur on the retracement phase so it’s too late. I need a step before thatt so it tells me to NOT open position. The crucial importance is refraining from opening the position before retracement happens and not when you already see retracement. The problem is that retracement could happen immediately or within seconds after I open positions and Trailing order wouldn’t be activated that quickly becouse trend wouldn’t move far enough from entry point so SL could be moved for the very first time plus extra 1 point in distance so Trailing gets activated. Additional problem is that I saw countless of situations when body size was by far smaller than body size of previous candle but retracement didn’t occur. Instead, continuation of trend did.

I didn’t find anything useful and trustworthy after page 28.

Summary: Thank you for pdf file. What is worth to consider is something I had known before. I found only one extra task that I added to my steps list:

‘’‘Be careful on less steeper trend than the one prior to that.This could mean lower momentum and higher possibility of retracement, particularly if sizes of bodies are getting smaller. Do not open position in such case.’’

Other than quoted sentence, I did not find anything helpful. I’m still wondering what else could be done here…

Glad you get all of that. But before i continue, i will have to make a fact concerning your questions “How could i know?”, the answer is you can’t. Among what’s still keeping going is accepting the uncertainties of the market. I want you to know that before you enter a trade, there are always unseen and underlying factors that could affect your trade either postive or negative - and you can’t control that which is where the discussion of having a system & risk management comes in.

On system, looks to me you had one and i will try my possible best to help figure out with you what could be wrong; while on risk management, while it’s best to define an entry and exit that won’t put all of your account at risk of margin call, it’s also advise to have an understanding how you can make balance between not setting a large stoploss from setting a tight stoploss.

Now concerning your system,

Rather than looking for a match, look for an entry in your defined analysis. Find out the overall trend on the H1 or H4 to get a bigger picture.
While making all those drawings and lines, make your charts clean and not complex.

I don’t know what you mean by alert but after defining the overall trend, what we’re looking for is our entry/exit zones.

Don’t complicate things, whether a range or trend, they’re what we look for in the bigger picture. Go back to step 1. If agreed, then step 3 is void.

I don’t quite get this well. But i would say, for our entries and exits, we’re looking at the close of the candle which is good. The crazy thing the hammer or rising or falling star won’t always appear or be the case for every moment. The key is having a clue of what’s happening at that given moment; which is why i use an indicator (which i will talk more about later) to help have a clue of what’s happening and from your 1st approach - the economic calendar, if it’s as a result of the upcoming or just released news, you can’t do without the economic calendar if you really want to be at a better side reason you might have to reconsider this approach.
PS: You don’t have to know all the numbers just idea of how the news could/would affect your positions.

I want to believe previous steps has resolved every of this not to make things complicated. Moreover, concerning the H4, you’re not looking for any sorts of candle close, this should be done at the timeframe you’ll be making your entries & exits. All the H4 is there for is a bigger picture of the overall trend and not the candle close.

I also can’t get what you mean’t with this.

Now concerning your questions…

No. You’re wrong! Trends don’t disrepect S/R zones, infact new S/R zones are made in a trend, and this zones are key areas. A price won’t always reverse when it touched the S/R zones, in this scenario where we have a price reached the S/R zones and break but was a false break, an expansion has occurred. But rather than moving those drawings at this zones, pay attention to the area it has an expansion and watchout for the price behaviour when it comes back to this area.

Whether or not a candle touches this area is less of a concern. What matters is you understand what the behaviour of the market is and what it is depicting.
Remember, don’t predict for the market, rather let the market do whatever is want to and make your judgements inline to these acts. Never make your judgements and expect the market to act inline with your judgement.

I might be forced to ask what defines your entries and exits at this point.

There ain’t any too much of S/R zones and if there’s according to you, from what timeframe is that? the bigger picture or from your entries & exits timeframe which should be in accord to what’s there on the bigger picture?
From the Yoruba proverb, “when trees fall on each other, the one on top is carried first”; which means even if there so much of that S/R zones on your charats, which one is given top consideration? you can’t tell me price is touching all of this zones same time which is not possible.

Nobody knows for sure, which validate my first statement concerning the uncertainties of the market. But the question is, when they do happens, how quick are you recognize they’ve arrived?

1 Like

Indicators might not be your idea, it’s not a bad approach. We have profitable traders who made use of the naked charts. You might have to pay more attention to how they could recognize the change in the market at the best time.

Small balances will always have a great influence on every of your trades. Reason it’s best advised to have a reasonable capital or best open a cent account.

Definitely a mistake. Look for a better approach by paying more attention to the psychology behind the candles at every zones/areas.

Wrong. Rather, current situation are decisions of what has happened in the past.

Absolutely. But know this that price might not always range before having a retracement.

The solution is pay close attention to key areas, the coming economic news and whatever uncertainties the market might throw. Know that every of the happenings in the price revealed the psychology of every traders in respect to whatever they think might be right or wrong; stick with your system regardless.

You might have to do more research on the “Elliot wave theory”, this is not an entry/exit theory but they best helps you have a clue if we’re having a retracement or a reversal.

You’re mostly welcome. I’ll be very much keen within my abilities to help. I will love to hear your feedbacks with warm regards, wishing you a great week ahead.

1 Like

Thank you again for response. I appreciate your patience and time for explanation.

I would like to state your text within quotation marks and my responses outside of quotation marks.

“balance between not setting a large stoploss from setting a tight stoploss.”

This could bring a lot of negativity too. The smallest retracement of a trend, after it had started to go towards wanted direction, could cause a position to be closed and ever worse, if Trailing has not been activated yet then it closes it in a loss. The position has to ‘‘breath’’ as the trend goes, right? There won’t be 100% always in wanted direction but it has to stay 100% always in profit. If it doesn’t then my tools will take care for automated closures. However, what worries me the most is that the retracement happens right after I open trading position, even if I open stop pending instead of market type of position. In this case, the position might not come to profit since the Spread functionality has to be solved first so position comes to profit for the very first time. Once it comes to profit, once the Trailing start to be active IF it does, it might be a good idea to let position breath, as long as profit won’t be non-stop decreasing.

“Find out the overall trend on the H1 or H4”

I do that and also on M30 but doesn’t work. There is always something, most likely something that I don’t know what should be done (a missing step in my analysis procedure), that causes the trend to go to the opposite direction, after opening a position, either immediately or within next few seconds or minutes. Always. What hurts the most is that the trend doesn’t go in wanted direction (meaning the one matching opened type of trade) for at least a little more of a distance so Trailing could be activated to protect me.

“I don’t quite get this well”

The logic is that the smaller the shadow of H1 and M30 is, the larger is the chance to have strong enough momentum to remain so at least Trailing could be activated. There are two purposes of making sure that shadow on those two time frames is not too large (I don’t know how large is too large but I assume it should NOT exceed the shadow on the same size of candle comparing to previous candle): One purpose is to check to find out that strong momentum continues as I already said. Second purpose is to NOT open any trading position while market price is in S/R zone but this second purpose is very problematic. I already said approaches from my first message should be ignored and S/R analysis often brings more trouble than benefit because of not knowing which one to use and there are hundreds of S/R zones. The only benefit I could get from economic calendar is to make sure BEFORE opening position that result of event (regardless of impact level) won’t cause retracement after opening a position. There is no way to know that in advance or is it? A potential step, worth to consider, is to check calendar a moment before opening a position, after all other steps are done. However, NOT all fundamental/macroeconomic events that move the market are defined on economic calendars on multiple websites. Besides that, checking the calendar a moment before opening a position, could be helpful strictly only if result was posted e.g. few seconds or few minutes ago and trend has not yet reflected it. It’s important to keep in mind that awareness of which trend direction could result of event push the trend is required otherwise I can’t estimate unwanted retracement. For majority of events I don’t know what trend direction could posted result mean. If position is opened and event result is posted few moments after that then it’s too late because retracement could happen. Of course one idea is to NOT deal with currency pairs that have single currency on either left or right side of the symbol if that currency is set on calendar for result to be shown in next few moments. However, that idea is nonsense and useless. Multiple currencies can be impacted on result submission of one currency. The result of event could also push trend further in direction matching opened trade (wanted direction) so refraining to open position just because result of event will be published very soon is pointless. Besides that, one currency can have multiple events with different impact levels to be scheduled (results) at the same time. Some results might push trend in one direction, some results in opposite, some results in neither. If result doesn’t push the trend anywhere and if I refrain from opening such position on alert and good looking steps then I’m in trouble because I miss an opportunity. Even if there was a calendar (but there isn’t, no website has that) stating for every single event what would a result have to look like for trend to be pushed down and what would result have to look like for trend to be pushed up, it’s still impossible to find this as helpful because you can’t know result before it’s posted. You can’t know whether it will effect the direction of a trend. It might be only helpful to refrain from opening a position (which is actually what I’m looking for!) but there isn’t much sense in this because of not knowing what result will be.

‘‘No. You’re wrong!’’

Just because some move happened in the past, there is no way to predict it will happen in the near future again from particular S/R zone. If price doesn’t retrace/reverse from S/R then that’s disrespection of S/R because it crosses beyond it. Do you have any educational material helping me to understand which S/R zones should be considered? Or is it only about checking consecutive large shadows? I have seen the charts where almost every single candle could be considered as S/R in their shadows (or tops/lows of bodies if shadows were missing). Impossible to know which S/R to use.

‘‘I might be forced to ask what defines your entries and exits at this point.’’

Entries define complex alerting tool, together with multiple tools I’m using for automated trend verification before position is opened on real account. Of course the manual steps (manual trend verification) I was describing in my first and second message are needed too before opening a position. Exists are mostly dependent on auto-closure tools or Trailings. The Trailing is basically a part of one of my tools (in-built functionality). I have no doubt that the tools I’m using are worldclass at highest quality. However, the real thing what is hurting me and causing me losing money all the time ( !!! ) is my zero knowledge and skill-set about understanding what exactly is moving the trend and when is this subject, which is mostly related to fundamental analysis (macroeconomic events), including the ones beyond calendar, going to end - I’m referring to when some event or something in countries that is moving the trend is going to end. I have total zero knowledge about this. I don’t know where and how to check it. Of course I’m aware about Refinitiv Eikon terminal (alternative to Bloomberg Terminal), I’m aware about variety of different relevant websites, etc. but still I don’t know how/where/when to check this and how to use such information. So the 90% of importance of trading (understanding what is NOT on charts so what is moving the trend) is something I don’t have and don’t know how to do it and this is most likely the real problem I’m facing.

Example: Years ago, when I lost ENTIRE balance on my first account, Apple had some serious problems with selling their products in China. This caused massive explosion of a trend on AUD currency pairs where AUD was either on left or right side of the trading symbol. Something like this, the economic calendar won’t be reporting and the crucial important is to find out this soon enough, not too late, not too soon, and to get to know how and why would this impact particular currency pairs. I don’t know how to do that. There are endless of additional background (fundamental) reasons that could move the trends, e.g. stoppage of some extremely valuable cargo on the national boarders, etc. Things like such, that could cause retracements, are hard to be found.

‘‘There ain’t any too much of S/R zones and if there’s according to you, from what timeframe is that?’’

H1 (main alert system) and M30.

‘‘But the question is, when they do happens, how quick are you recognize they’ve arrived?’’

I believe you were referring to ‘‘retracements’’ when you said ‘‘they’’ and if so, when they happen, it’s already too late. The entire purpose of my message is to seek for elements that will cause me to NOT open the trade when everything (according to my level of knowledge) is looking acceptable. I’m not sure how exactly to answer your question here. I probably don’t recognize but what I am focused at is that after retracement happens, the opposite direction becomes even stronger and doesn’t stop. This results in the following: A MT4 tool, opens trade in opposite direction for larger investment (e.g. 180%+ size) and both positions are closed when the SUM of both (one in loss, another in profit) is positive so I would not lose any money. The problem is that after initial retracement happens, there is always something going wrong that the trend goes again in my first position direction OR that opposite position is not yet opened (direction not far away yet) and entire balance on account burnt instead. Doing smaller time frame for opposite position to open is too risky. My answer on your question is that I don’t really recognize it but if I did, what should I do then? Close the position in a loss? I don’t think that’s a good idea.

‘‘Definitely a mistake. Look for a better approach by paying more attention to the psychology behind the candles at every zones/areas.’’

I would appreciate some graphical lecture here if you have something to show what do you mean. What I should be doing…

Besides my previous message, I’m attaching another disastrous case currently, right now, in progress. Prior to that I had yet another today when I was literally dying of anxiety that account balance will get burnt again but I somehow survived. I can report it later but would like to be fully focused on below case.

almost the same here - throughout my whole trading career i’ve always done significantly better with buy/sell-stop entry orders than with market orders

1 Like

[quote=“flamingoproxy, post:17, topic:1165348”]
almost the same here - throughout my whole trading career i’ve always done significantly better with buy/sell-stop entry orders than with market orders[/quote]

me too, i do stop pending orders

I just lost my entire balance for 5th consecutive time. Everything I have ever worked for, for my entire life, is gone. I completely burnt four different accounts (the balances) prior to that in past four years. I had to borrow yesterday the last money I found (not my), which wasn’t my, to be able to do deposit.

How on the planet earth am I supposed to understand from which S/R line will price retrace, this is something I will never understand.

A step away from suicide. I can’t live like that anymore.