Hello there, traders!
Here are some educational chart patterns that you should be aware of in 2022 and 2025.
I hope you find this information useful and educational.
We are new here, so please help us by liking and commenting on our posts.
Please leave any questions in the comments, and we’ll do our best to answer them all.
What Is a Wedge?
A wedge is a price pattern on a price chart that is defined by converging trend lines. The two trend lines are drawn to connect the highs and lows of a price series over a period of 10 to 50. The lines show that the highs and lows rise and fall at different rates, creating the appearance of a wedge as the lines approach a point of convergence. Technical analysts regard wedge-shaped trend lines as useful indicators of a potential price reversal.
Understanding the Wedge Pattern:-
A wedge pattern can signal either a bullish or bearish price reversal. In either case, three characteristics are shared by this pattern: first, the converging trend lines; second, a pattern of declining volume as the price progresses through the pattern; and third, a breakout from one of the trend lines. The wedge pattern comes in two varieties: rising wedge (which indicates a bearish reversal) and falling wedge (which signals a bullish reversal).
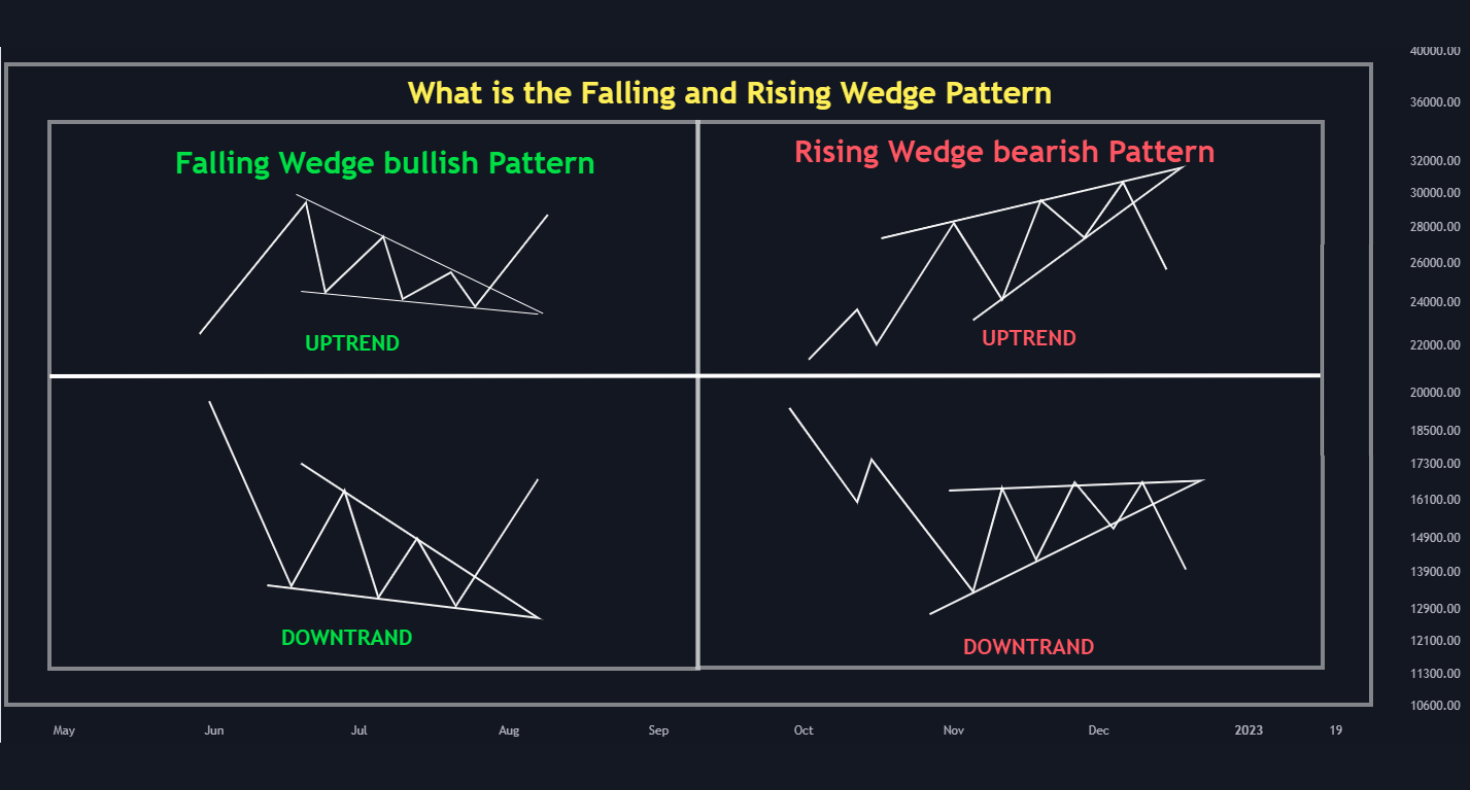
Falling Wedge pattern:-
When the price of a security has been falling over time, a wedge pattern can form just before the trend’s final downward move. As the price slide loses momentum and buyers step in to slow the rate of decline, the trend lines drawn above the highs and below the lows on the price chart pattern may converge. Price may break above the upper trend line before the lines converge.
The security is expected to reverse and trend higher if the price breaks the upper trend line. Traders who identify bullish reversal signals should look for trades that profit from the security’s price increase.
Rising Wedge pattern:-
This is most common when the security’s price has been rising over time, but it can also happen during a downtrend.
A trader or analyst can use trend lines drawn above and below a price chart pattern to predict breakout reversals. While the price can break out of either trend line, the wedge pattern has a tendency to break out in the opposite direction from the trend line.
As a result, the ascending wedge pattern indicates a higher likelihood of further price decline following the breakdown of the lower trend line. Following a breakout, traders can enter bearish trades on the basis of a charted security, either by selling the security short or by using derivatives such as futures or options. These trades will attempt to profit from the possibility of a price drop.
Trading Profits for the Wedge Pattern:-
Price pattern strategies for trading systems rarely outperform buy-and-hold strategies in the long run, but some patterns do appear to be useful in predicting general price trends. Huh. According to some studies, a wedge pattern will break out toward reversal more than two-thirds of the time (a bullish breakout for falling wedges and a bearish breakout for rising wedges), with a falling wedge being followed by a rising wedge. Is a more trustworthy indicator than the wedge.
Because wedge patterns converge in a smaller price channel, the distance between the price at trade entry and the price for the stop loss is relatively smaller than it was at the start of the pattern. This means that the stop loss can be placed closer to the time the trade is initiated, and if the trade is successful, the return can be greater than the initial risk.
Wedge a Continuation or a Reversal Pattern:-
The wedge pattern indicates a trend reversal. Depending on where the trend line intersects, the trading volume, and whether the wedge is falling or rising, the reversal is either bearish or bullish.
Trade with caution.
If you like it, click the like button and share your charts in the comments section.
Thank you very much.