Hello fellow traders. In this technical blog we’re going to take a quick look at the Elliott Wave charts of IBEX, published in members area of the website. As our members know, IBEX has made recently incomplete bullish sequence in the cycle from the December 27th 2018 low. The Elliott wave structure had been calling for further upside in short term. Consequently, we advise members to avoid selling the Index until extremes from the 12.27 low gets reached. In further text we’re going to explain the Elliott wave structure and Forecast.
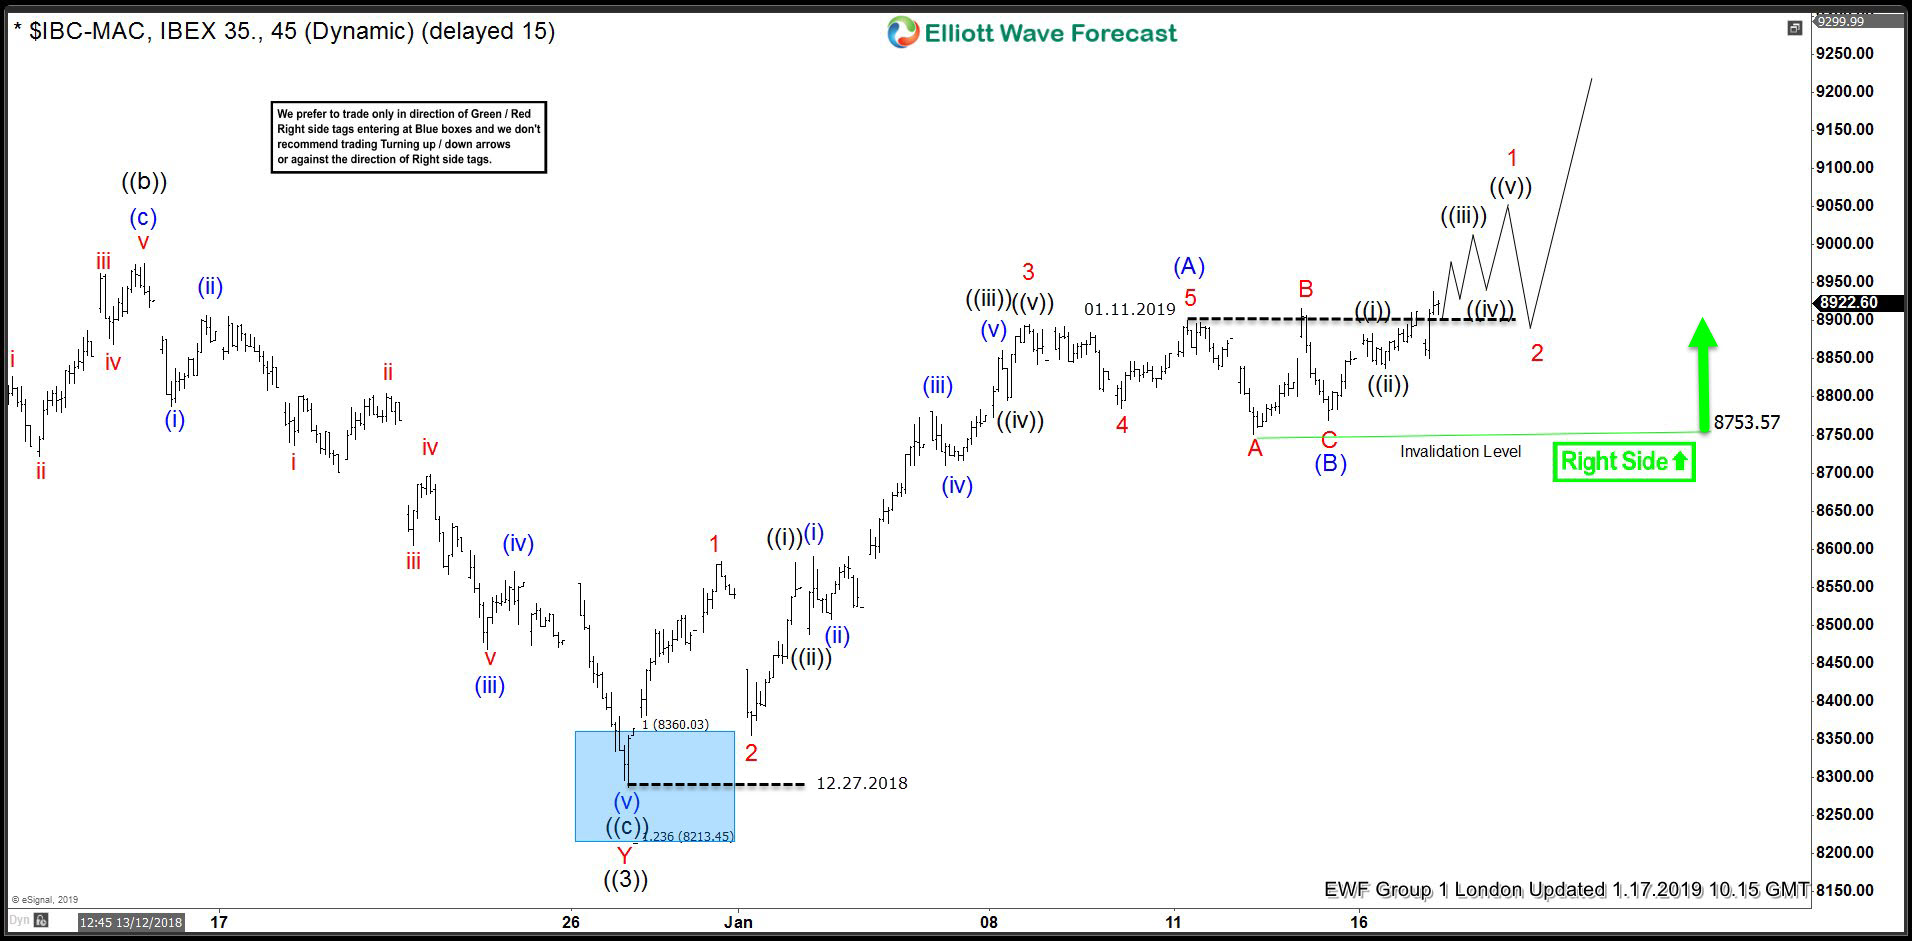
IBEX 1 Hour Elliott Wave Analysis 12.29.2018
As we can see on the chart below , the Index has 5 waves structure in the rally from the 12.27 low, when pull back against that low has unfolded as a Elliott Wave Running Flat- wave (B) blue. Cycle from the December’s low is labeled as Elliott Wave ZIGZAG pattern. Break of January 11th peak made the cycle from the December 27th 2018 low incomplete to the upside. The Index is now bullish against the 8753.5 low and we’re calling for further strength . The Index has scope to reach 9368.4 area before sellers appear gain. We don’t recommend selling the index at this stage and favor the long side against the 8753.5 low.
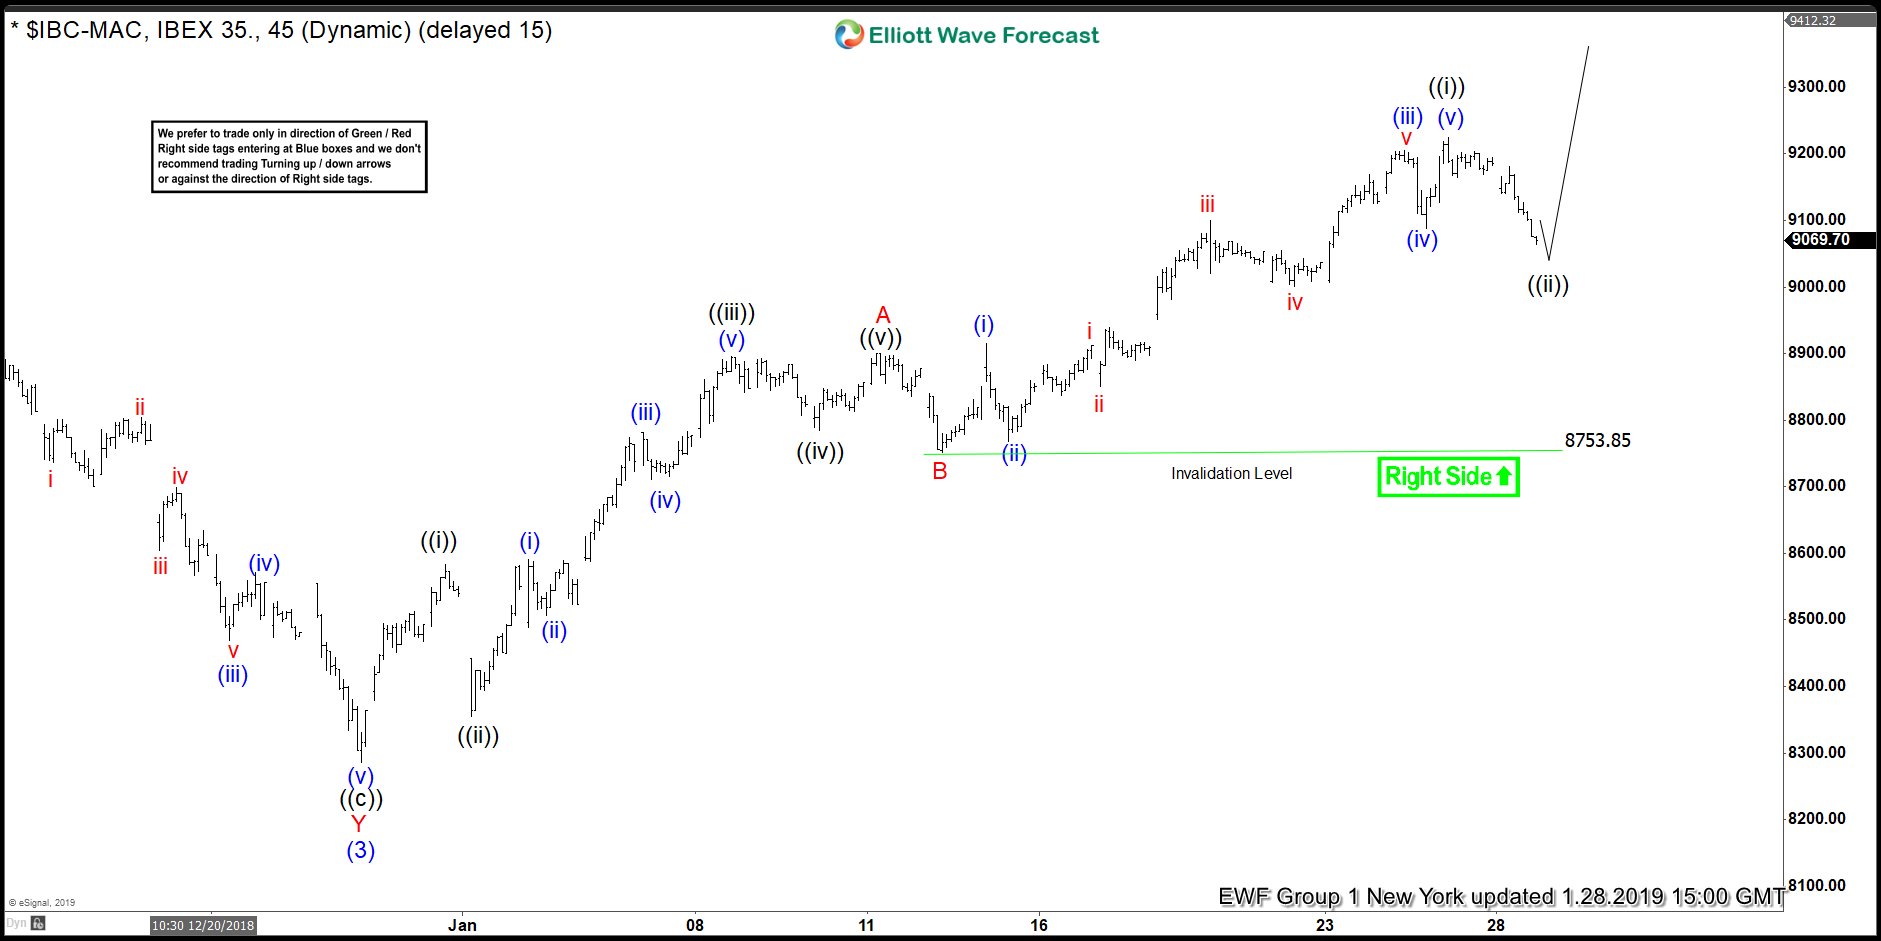
IBEX 1 Hour Elliott Wave Analysis 1.26.2019.
The price has held pivot at 8752.3 low nicely so far, and IBEX is trading higher as expected. As far as the mentioned pivot stays intact, the index can remain trading higher toward 9368.4 area, when we’re still in wave ((iii)) of C of proposed Elliottwave ZIGZAG pattern.
Keep in mind market is dynamic and presented view could have changed in the mean time. Best instruments to trade are those having incomplete bullish or bearish swings sequences. We put them in Sequence Report and best among them are shown in the Live Trading Room. You can check most recent charts in the membership area of the site.