In this article, we look at the long-term view of IBM which we believe ended an Elliott Wave Grand Super Cycle from all time the low and is currently correcting that cycle. We will look at the preferred structure of the pull back, where we are within the correction, what is the swing sequence suggesting and also highlight an area that could be interest to the long-term investors. Let’s start by taking a look at the quarterly chart of IBM below.
IBM Long-Term Elliott Wave Analysis
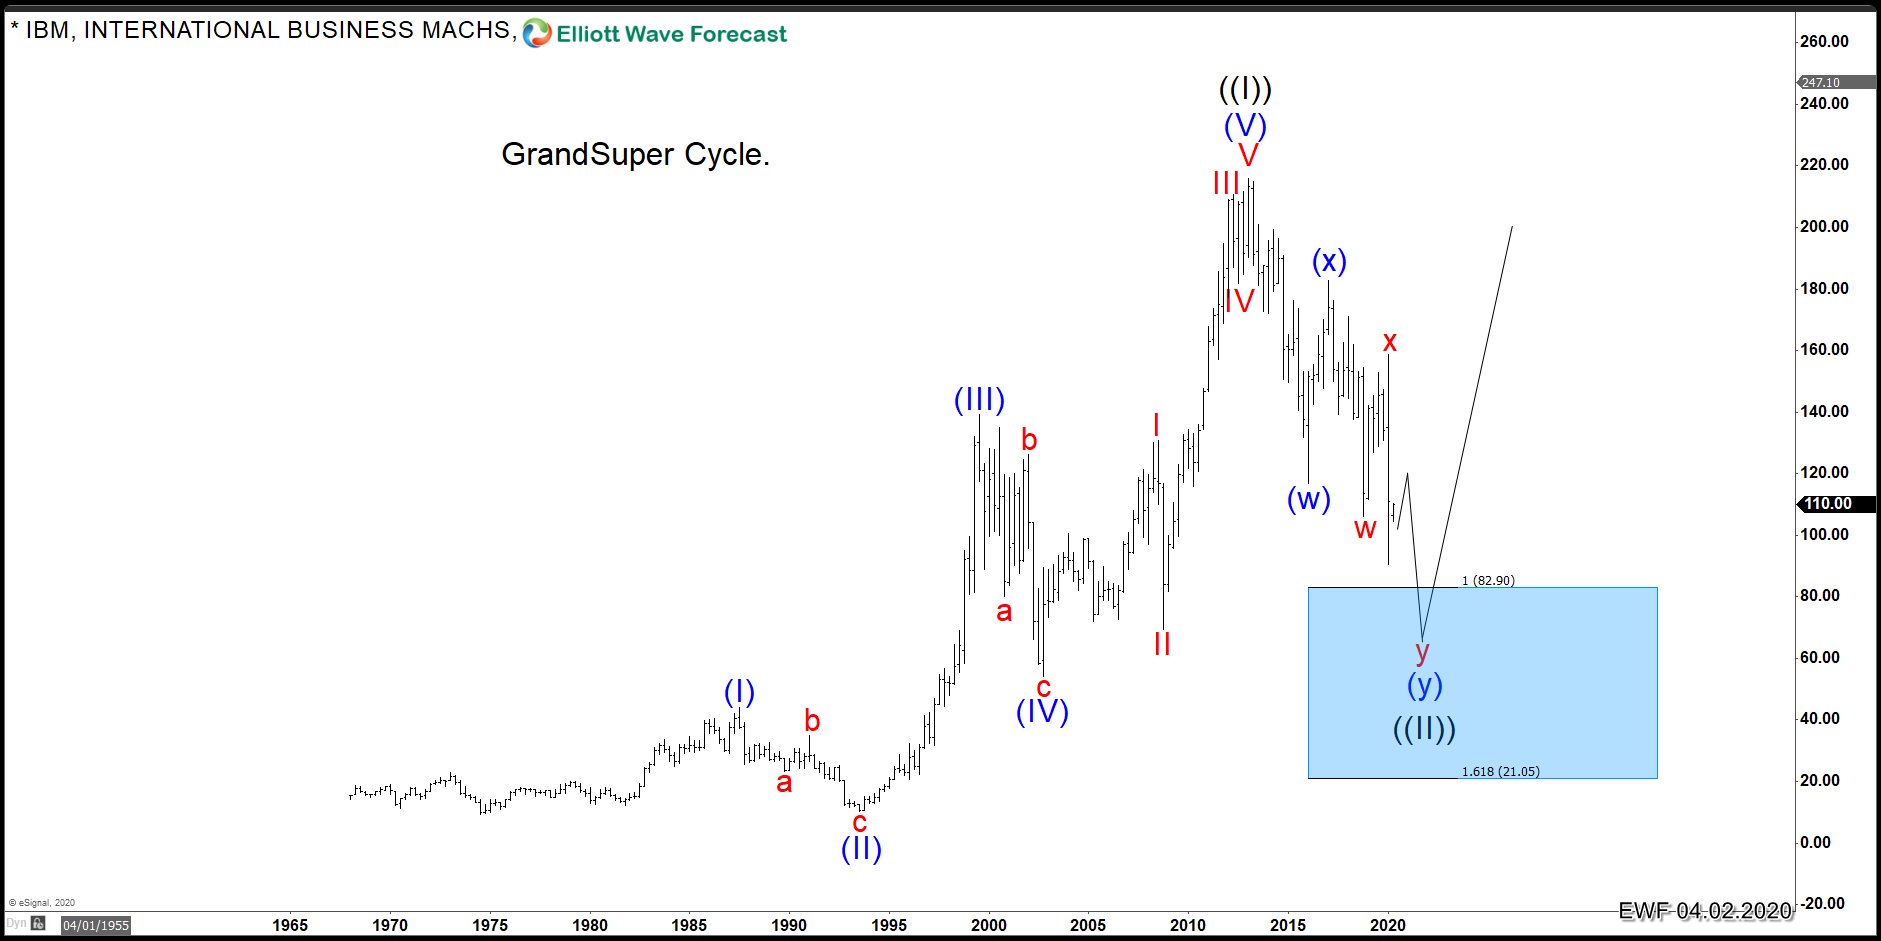
Chart below shows a complete 5 waves move up from it’s all time low when wave (I) ended at 43.97 in 1987, wave (II) completed at 10.16 in 1993, wave (III) completed at 139.19 in 1999 and wave (IV) completed at 54.01 in 2002, wave (V) was extended and completed at 215.90 in 2013. According to Elliott Wave Theory, once a 5 waves move is complete, market should correct the 5 waves move and this corrective move could take different forms.
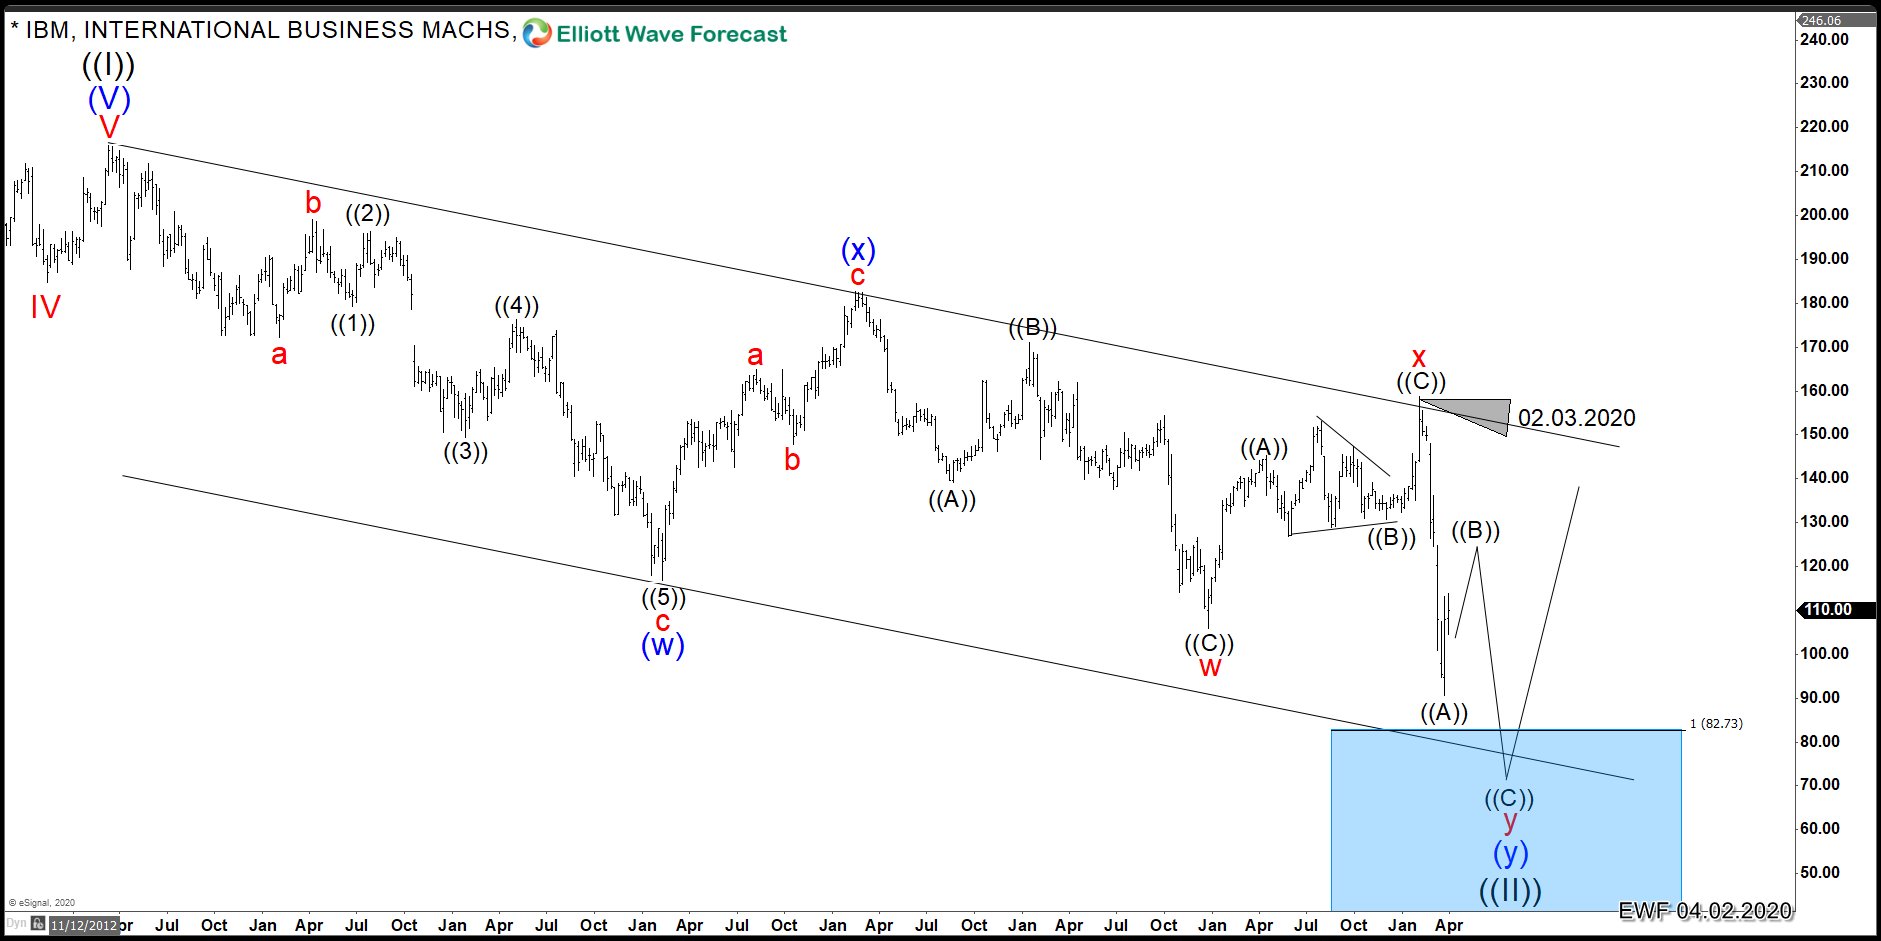
IBM Weekly Elliott Wave Analysis - 4.2.2020
Chart below is the weekly chart and provides a closer look at the structure of correction which started way back in 2013. Initial decline from March 2013 peak to February 2016 low was a Zigzag Elliott wave structure. This was followed by a 3 waves bounce to 182.79 (February 2017) after which stock dropped below February 2016 low creating an incomplete sequence against February 2017 peak. Stock then saw another recovery which ended in February 2020 and we have now seen a breach of December 2018 low, if we count the number of swings down from blue (x) peak, we can count 5 swings down and it’s not an impulse or a diagonal because the biggest correction is in the middle. This means the swing sequence down from blue (x) peak is incomplete and while below February 2020 peak, stock should ideally make another push lower to complete 7 swings down from blue (x) peak. Ideal target area is between 82.73 - 59.15 which is 100 - 123.6% Fibonacci extension area of blue (w)-(x) cycles. 161.8 Fibonacci extension comes at 21.05 and as it’s a corrective decline we would expect it to stay above this level and then stock would have a chance to resume the rally in the next leg of the Grand Super Cycle.