Ichimoku Trading System

That where it was! Seems like the table was correct after all. I am on MT4 IBfx mini and on the order window there is a dropdown list and you can key in specific size. What I couldn’t get is why the dollar amt for say 0.5 size 50pips is $250 on table but 25 on platform. I’m salivating over the Koala statement he’ got there and I notice it conforms to the table values. It is only on IBfx?

I lost all my charting work for the last 2 months, crashed my OS , ‘leave current file system intact’ refused to work anymore, had to format, forgot to save profiles folder and now I have been trying to set s+r and EW count back on five charts.

Tue230210: Last wk $Cad stopped minimally; EY 123.60 posn held over the weekend doubled it 124.00 today and had to exit -66p and - 42p, down 2.6%bankweekopen; E$ 1.3681 long R=6% stopped in my absence -121p, down 6%bank!; then everything went short and just couldn’t help myself - exited after recouping position: G$ 1.5420 SL=100p R=4% exit 1.5451, down 1.2%; GY short all 140.25, 140.00, 139.70, 139.40 SL=100p R=4% exit 139.49, .52, 57,56. Don’t try that at home - the rules for pyramiding in are subsequently smaller position sizes.


“For LONG position: The support on Chikou Span right below the price you enter is your STOP LOSS level.
The resistance on Chikou Span right above the price you enter is your TAKE PROFIT level.
And vice versa, for SHORT position.”

Can somebody please explain what does it mean by this ? I have been trying to find the meaning and trying to understand it for a couple of days and I still don’t really understand.

Cheers.

I think that condition was constructed alongside that of placing the SL below/above the last price extreme in PriceActionAnalysis and as such is correct. I on the other hand has found that if you maintain a constant mode for mounting trades then you gain a bit statistical advantage, somewhat predictable lottery? In short, I don’t see that condition in any of my current trade entries.

For wider daily range like GY and G$ I use 140pips max SL, but usually 70p and 100p. For Mad trading like London Breakout, I may use 35p, but most of the time it wont work well, especially on the GY it’d never work.

For those strategies that employ small SL didn’t survive todays LondonBreak wicks like on 4 pairs? But on other days it may save you. If you can watch the charts, then enter on any London volume, the trade goes positive immediately for like 35p, then comes back fast. Jump out at slightly above BE all trades / day open, to let it pass, maybe its called trader discretion?

1300GMT/240210: today has tones of correction on yesterday’s shorts. Those positions are today’s Asian session on pin-bar completion (my charts aren’t clouded yet so I can still see them). The Euro has sort of hit turning points on both charts good pips from KS D1. Whats with that line on GY. I don’t trust the Gbp and gave it R=2% each, so I don’t mind what it is doing.

Checkout my new gatleys! How do they go with my E$ and jeans? See thread – real fine stitching.


Thank you very much. Very nice, concise and useful summary of your S/R analysis.

So much for my safest stop-losses, I got stopped out of ALL four positions entered above, then compounded my mistakes further as usual, down almost 20%bank last wk-open and I knew I had to chill-out. Finished my charts, and immediately saw my mistakes. Entered new positions on the all-new-cleaner-precise-updated charts and I’m doing much better. Will post more 4H charts right B4 market open, these are the Longer-term EW outlooks.

I’ve been trying to fumble with a blend of the best Position-trading strategies (EW, IKH) I didn’t know you were learning S+R off it. That’s encouraging to hear. Most of the S+R technology I got from the thread mentioned back there, but instead of trying to draw zones, I place kind of stairs or ruler with three colour coding and for MT4 description I fill a code that displays type (s+r, scalp, stair), price level (notice the rounding off), reference date and date of fixing (during forward- or back-testing – guess I lost all for bt), time frame visibility max, strength (coding under construction), e.g. on G$ see: scalp1.5000_ft#010400/220210_MN1 priceline; and description, with KS and Kumo tables, old. This info displays for most pieces of dirt on my charts every time I mouse over an object. The stairs are only visible on H4 timeframe, and are the most important, and vary much.

If I keep trying to explain further I’ll wear out the keys, but I can give you a current copy of my C:\prog.files…\MT4\profiles\ew-ikh for the GBP to learn from and develop your own style, that way you’ll have built your house from the top down. This is on the premise that: even if I gave it to the whole world everyone will see different things; I was using them last week when I was trading in the opposite direction & they didn’t save me; if all forex speculative traders were to use IKH on D1 the system would still hold since the main market players don’t care about 140p change; and lastly knowledge ought to be open-source so as humanity can ready itself to surviving the worsening of global warming and finally Armageddon and the rush to colonize outer space.

I’ll start doing EW analysis over at where I got those gartleys, so I won’t be doing it here to avoid duplicity. My trading is quite influenced by my forex foundation being in scalping <H1 timeframes – common across most traders, I can’t stay put long enough for the good trades, like 500p and beyond?


How do you determine Support & Resistance using the Chikou Span? :confused:

I don’t determine s+r using Chikou-span, but the technique will yield similar results. I use price extreme points like wicks and especially close price using price-line instead of candles starting from the highest timeframe going lower. Those of lesser timeframe won’t be visible on the higher frames, and the ones set on higher frames will appear only on major price extremes and the roundest numbers on lower frames. On H4, I mark the last s+r and scalps, then stairs instead of zones – light coloured lines measuring inch progress, and those too work! The ones currently being employed on G$ are set using the wave on the other ridge back there in May 09. Similarity comes in that Chikou-span is current closing price (the price-line) shifted backward 26 bars/periods and coloured different.

This is the same as is taught in the book in the BP forums’ link below – what happened to the mayor of that thread must be quite sad I may consider doing the next pdf myself?

Had two short positions on GY from Friday, one hit TP on market open (GY short136.00; R = 4%, SL = 50p, TP = 120p: hit TP, Net = 8.1%bank last wk close/this wk open), the other I just closed (GY short136.30; R = 4%, SL = 50p, TP = 285p; Exit = +94p Net = 7.6%). I also jus closed G$ (short 1.5190; R = 2%, SL = 100p; Exit = + 15p) from Fri since it is going nowhere/opposite.

Open positions on E$ from Fri (long1.3535; R = 4%, SL = 90p, TP = open) and the fresh EY (long 121.85; R = 4%, SL=140p, TP = open).

0900gmt/Mon010310: The E$ and EY pairs seem to have made a turn. Looking for break of channel/trendline on E$; see candle action; D1 frame IKH looks bullish in the short-run (2 or so days) towards KS and Kumo; strong support at 1.36. See EY daily candle action; D1 TS 60p, KS 200p away; still can’t decide gauging H4 if I’m early or late? The Gbp pairs may show final bearish action, then sideways correction. G$ scraping lower EW minute base channel; will have turned at 100% projection of previous down-wave similar degree – too soon? D1 TS, H4 KS 180p or so away marks max retracement limit, then more bearish. GY also heading down very few pips, then correction. Alternatively, the Gbp especially GY may form those sudden loops of three candles surprise, though not on a Monday.

http://forums.babypips.com/free-forex-trading-systems/25839-my-basic-chart-analysis-method.html


010310_D1 outlooks.zip (180 KB)

2100gmt/020310: Those open trades closed out negative, regrouped, and entered three pairs today London break, EY didn’t survive. Current positions: E$ long 1.35400, R = 2%, SL = 120p, TP = R = SL, SL now trailed at TS H4; GS long 1.4955, R = 2%, SL = 80, 100p max. Figuring to stick in E$ depending on tomorrow pre-0800, or wait to re-enter at1.3670. Waiting for GY to either cross that fibo-cum-trendline for abc, or do a final lurch for current minor five lower base channel.


0700gmt/080310: My second longstop E$ hit on last Friday, and also in G$ after inverting in a hurry since it broke “the green” channel. On E$ expecting more overlapping, current lap to touch 1.37s then back for KijS H4, may go past 1.3780 for some fibo level 1.38, then back for wave (v) start complexes, viewing on D1 may go for Kumo resistance then down. Having adopted an alternative count on G$ looking for test of 61.8% retracement, channel-upper test, 1.5280 or 1.5300, D1 KijS. GY next major jump looks bearish bouncing off D1 KijS, 50% proj of major wave 1 on current 5, minute iii of 5 upper channel, and 138.00; bullish past that then overlap of (4) on (1) will necessitate alt count, though minuette (4) complexes on H4 not over yet? EY D1 looks to test Kumo resistance then bearish wave ii complex of next wave after turn c, viewed at H4, bearish for KS, 1.2100 should hold, past 120.00 false turn.


When is a good time to be trading Kumo breakouts? When do kumo breakouts tend to happen?

What does it depend on?

Thanks!

Kumo break is something anyone would call price coming past/outside the Kumo cloud, just as we’d call a Tenkan-Kijun Sen cross, TenkSen break/cross, or another IKH signal. It is not an event by itself that tends to happen sometime or the other, but a signal like the rest which can happen anytime on any chart. An example is what EY is doing now on H4 time frame?

I believe what you were about to ask may have been about London Breakout, or London Rush? These are just names designed to distinguish between the two active sessions of London stox exchange. They are better seen if you switch to H1 timeframe and put a volumes indicator (visible only on H1), there are three peaks in volume each day, the Asian session volume peak of 0000 & 0100gmt, the London open/Breakout peak of 0700 – 0900gmt, and finally the 1300 – 1600gmt London-NewYork overlap, FuriousAngel called it the London Rush and I sort of like the name?


Thought to post something to break silence and keep the thread alive, might as well do so since I’m still using the Ichi system, to learn more in the quest to teach, & to make myself feel good and dust off the rust among other varied reasons. I hope that if I keep this up guys might start to catch on the ‘wave degree’ & ‘alternative-count’ lingo? A flat correction has nothing to do with changing bad tyres.

It would be good if a discussion of the Elliot wave could take that form of precision here on babypips. Not that there is much to change from what is provided by the EW gurus at AF, but since they give upto D1 timeframe minor degree count, we could discuss about counts and wave forms observable on H4 minute or even less (minuette and sub-minuette on H1, the hardest and most precise), the correct counts which would enhance intra-week trading. And the Dow charts…

I take trades based on ichimoku, and keep the EW counts and fibbs for trend navigation, to know the market position at any given time, and thus the two are indispensable in my view. PA and S+R feature heavily in my methods. The EW technology I got from ‘10 lessons in EW theory’ from the AF site, non-downloadable, so I copy-pasted every bit and printed in pdf, boiled it and drank the soup (sic). I think the hardest part is grasping ‘the Essential Design/Wave forms’ and ‘Wave Degree’, otherwise why don’t I hear anyone else talk of where we’re @ in the overall market cycle.

Along with the Pretcher teachings are hot articles which disqualify convectional financial thinking at several levels (like how the stimulus packages are hurting the taxpayers and ‘homeholders’ while rescuing the real culprits and homeowners – banks; or when the count is such that the bottom of the last 2009 recession phase isn’t the lowest the markets will go – scary huh? Thrilling.), which I need to run through you guys.

I currently have EY, E$, G$, GY & $Y charts up, and may have trades in up to four pairs. What I’ve gathered so far is that these pairs move in tandem, E$ setting the pace, or in other times when G$ completes a wave and makes a turn all others will be doing the same thing more or less. Sir Elliot came to somewhat the same conclusion in his studies of the DJIA, and an ardent of the theory ought to keep such charts. Here’s my DJIA studies, at last.

Most of this study has been done by the Pretcher guys at AF, and this post is thus largely adopted from ‘The Independent Investor’ e-book from EWI: in chapter three, Pretcher enters a detailed analysis of the DJIA & World Stock index. The up-move from 1929 NYSE trading-floor inception is only a part of the World Stocks index up-move coming from the 1792 NYSE Wall-Street-inception & pre-1700 London Stock Exchange inception. Most DJIA data available online in excel-mode starts from 1928/9.

The first showing overall world stock markets’ rise since inception(s) (where did they get this data from) semi-logarithmic scale, labeled as wave {III} grand-supercycle from 1790 bottom peaked around yr 2007, which now puts us at beginning wave {IV} grand-supercycle correction.

The second chart views the data from the 1932 bottom to the 2007 peak, labeled as supercycle (V) impulse. The third chart views from the 1974 low to the 2007 peak, labeled as wave V cycle degree completed(ing). Notice how the data plotted on semi-log scale makes more Elliot-sense as opposed to arithmetic scale, and the charts belong to EWI. From here, we’re sort-of on our own – can’t seem to find more relevant free stuff on the subject.

The fifth chart shows the bear market from Oct 2007 to Mar 2009 DJIA daily close and a subsequent correction to date, whose wave count will largely affect our current trade targets. I can’t get enough of staring at it.

grand-supercycle, from 1700.bmp (780 KB)

supercycle, from 1930.bmp (779 KB)

cycle, from 1974.bmp (782 KB)

World Stocks Index, frorm 1974.bmp (761 KB)

DJIA, D1close arithmetic from 2007.bmp (691 KB)

Now, the cycle wave V chart above shows up to around the 2002/03 lows, and excludes the 2007 high because it hadn’t happened by the time of the aforementioned article. To include the missing impulse in the cycle wave will necessitate changing the cycle wave V count to accommodate this advance as primary {5], with the previous pri {5} wave end now labeled as pri {3} of cycle V.

The new-look cycle V properties: pri {1} and {5} equal; pri {3} extended, with its intermediate (5) being the extended sub-wave; pri {4} ends in the range of int (4) of pri {3}; pri{5} has an extended int (5) and both arithmetic and semi-log chart data fits in a base channel snugly. After much pencil-work and clicking, that’s the most satisfactory count I could get.

At this point, I may add that I’m using Excel to create the line charts, and then Paint to yank around the semi-log charts into shape, then Word to insert the count labels, then Publisher to group the labels with the chart and box, then Paint again to save the image as a stand-alone picture, then Windows Picture Manager to crop image size, then all over again. I bet it’s the long way there, though I already got the hang of it, but it isn’t working well enough for semi-log charts of primary degree and lower - will anyone with a better idea for charting Excel-format data or loading it onto MT4 please stand up.

210410_djia mn1 super(v).bmp (408 KB)

210410_djia mn1 super(V)cycle v.bmp (381 KB)

210410_djia wk1 pri[3]cycleV.bmp (427 KB)

210410_djia d1 pri[5]cycleV.bmp (390 KB)

In an Aug 2008 EWT article still in The Independent Investor e-Book (see point on chart), Pretcher hints that the bear market trend from Oct 2007 to Mar 2008 was a corrective wave with the current wave back then being wave C looking for further fall below Mar 2008 bottom - which it later did to hit Mar 2009 low. That’s as far as he’s taking us for free in this count.

Looking at the bear-market wave from Oct 07 to Ma09, it fails to meet basic conditions of an impulse form in terms of wave equality and channeling, with numerous overlapping for its sub-waves; the fifth wave of that impulse-count would fail to meet basic conditions for an impulse.

Oct 2007-Mar 09 is preferably labeled as a zigzag corrective primary wave (A), with its int © impulse wave longest sub-wave. I consider labeling it intermediate (A) since it takes 17 months which is shorter than most primary waves in preceding data: the shortest primary in cycle V- pri [1] - takes 22 months; corrective pri [4] wave of cycle V takes 32 months… I’ll look up other waves similar in form.

I still feel it is a primary [A] because: it ends within/beyond range of one degree lower int (4) of pri [5] cycle V like an ideal pri [A] would; some corrections tend to be brief (market crashes) compared to surrounding pri impulses in cycle bull market(s)?; gauging distance and time of cycles, there’s a weak case for it above primary degree. I’ll be more certain after further ratio analysis in subsequent posts and as the wave unfolds, right now I stick with ‘it’ being primary.

Therefore counting from Oct 2007 to Mar 2009 viewing a candlesticks chart, int-degree bearish wave (A) corrective zigzag (335); its intermediate sub-divisions wave A ended Jan 2008, wave B ended May 2008 & C double zigzag, or five-wave impulse, ending Mar 2009.

The next wave bullish from Mar 2009 bottom to date is an impulse, I think of primary degree when it ends. I’m not sure enough to label it yet, maybe after seeing how it closes?

djia_pri [3] cycle A’.bmp (834 KB)

djia_pri [3] [4] & [5] cycle V.bmp (895 KB)

djia_pri [5] cycle V.bmp (828 KB)

djia_pri [A] cycle a.bmp (808 KB)

very quiet in here. Don’t you get lonely?

Noticed this is an old thread but I will give this a chance.

I’ve been looking for a new system as my trades have not been doing well lately. I set everything up and like the way it looks. I can not see where you are getting support and resistance. Also, for entering a trade, do you go with the opening candle trading in the direction of the trend? Such as if the trend is down do you only short on a bearish candle?

Thanks for any help

Yeah it gets too silent at times, it’s rather encouraging though, to see all these many peeps silently lurking around… Me, I have to stick around somewhere anywhere to see if I get feedback for my burning queries, I have those too you know? Its either here like this, or outside in the weather, or gazing at live h1 charts and loosing money in real-time – choose your poison.

When you set everything up, you can gaze at still charts for hours, and you’re sure you’re not seeing things because you’re scribbling on paper for posterity. Take the E$: starting at mn1 timeframe, I have labeled waves of primary, intermediate and minor, set the major s+r’s (blue) & scalp(brown), then down to wk1 timeframe set even more scalps; on d1 set some more scalps… by now were sporting a rather crowded population, so I’ve got a method for labeling them (like ‘s+r 1.3600 _#1212804 /220210_wk1close’, description ‘7mn1closes, 12 wicks and Kumo tables’); on h4 I have the last scalps, and other lighter lines which I move around a lot. Those of lower timeframe aren’t seen on higher timeframe. Fire up IKH visible on h4 and d1 only, and label the EW count (with accurate description) for the last minute degree, and maybe minuette, wiggles. That fibb there is the projection of minute[i] of minor A intermediate ©, for minute [v]; now the current [v] is testing 61.8% projection.

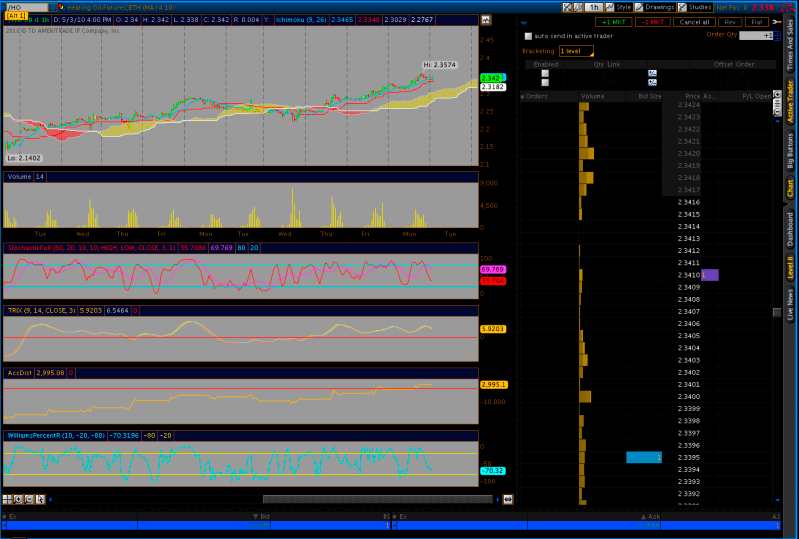
Now see the last chart h4 used for actual trading, notice how reversal price-action happens at or near these lines, and how they relate to the IKH levels of equilibrium, and how a wave end/turning point orchestrates. The main reversal bars (at great or so location) happen, then TS gets tested then broken, going for KS…kumo break…all crossed. They now act as resistances, with mainly KS on h4 or TS on d1 & s+r lines calling the entry and exits, and price-action (shape of candles) showing wave progression. Use stop-orders, so whether the candle is halfway or closed, you’re in when the surf comes to you, and out when it’s gone.

I’m looking to trade All impulse waves, minute degree and above, 70pips on H4, 250p is very fine, if I catch 1000p on GY I may have to close shop for the month to count the spoils. If wave [v] is over and 61.8 proj holds, then I’m looking to exit the remaining position from trading 1.3600 –and a dumb half-position at 1.3300 – at 1.3420. If Ks resistance holds with nice price action, I might add another final half-position looking for 100% proj. To be here, I have messed up like three other trades around ii and iv and this is not a no-brainer-enter-at-cross system. But of course, they were shorts running small profit, and thus I didn’t have to wait for SL=50p or 140p to get hit, just see adverse price action closed and jump out with whatever to regroup at better position tomorrow without overdoing it by staring at moving charts (do the DJIA in the meantime?). But what if 1.3120 is retested without breaking (the ICT observation) and price takes off bullish again for 1.3400, I’d know to look for a second-wave of an impulse up and price action response to that location, and take it.

You know I can answer ten more questions, right? This time with G$?


ICHIMOKU - Any market, anytime!

Been trading stocks using Ichimoku for close to a year now. I have it all posted in an online journal known as ‘Ichibomb’. Trying my hand at futures. Rode Heating Oil Kumo break for some nice gains.

Awesome posts Chizz

I find trading Ichimoku online to be lonely at times too. Not everyone gets it as easily as others. I think it’s one of the greatest indicators ever created. Short term, mid term, and long term resistance/support levels are unmatched. The breakout type setups and bottom bouncers that that occur are nearly identical every single time. When trading stocks, I felt like I was shooting fish in a barrel :eek: