Ichimoku Trading System

Thanx; I checked out IchibomB – looks like guys there have reasons to get elated too – using Ichi, there’s no way one would have missed something h4 short to get a stroke about? Trying my best not to sound elated. Never tried stocks – do they have those demo/abacus’ for stox/futures? I agree, a chart is a chart is a chart is a…any market anytime!

One thing though, all my EW counts were anticipating some bear, but the EY was looking up and caught me somewhat off, ended up fumbling with my three wishes on that particular chart. Thus minute c there was false. Might do some forex count down the posts; let me hurry the DJIA studies and over with, get back to pure ichi-forexing as the thread suggests. I wont trade the Dow, but hope to lay a base for subsequent lingo, and jus searching for any hidden treasure.

nice. yes, you can paper trade stocks, forex, and futures using thinkorswim

Here’s one of their charts tweaked to my liking. I really like this platform.

I don’t typically trade forex as I’m a stock/futures trader but I’m very interested in applying my method to the forex market.

USD/JPY is now trading at 93.31. A difference of 96 pips, correct?

I’ve never really been able to tame the $Y – they should have it at the rodeo with a warning? See how even on the great timeframes it won’t give you a decent impulse, all overlaps, wedges and flats. But I still have the chart up to complete my circle of analysis – notice I said upto four trades on five charts. 96p from what? Want my take on it?

Remember I used to get the EW count for the larger degree(s) off ActionForex for almost all major pairs? That changes starting this month; all I now see there is the three or so most straightforward counts (E$, G$. & EF?); the harder pairs like GY, $Y Aussie & $Franc are updated no more? That shouldn’t be sad because we’ll never fall behind in the counts, will we? Can’t fault them, they go wrong like the E$ situation there they start to loose credibility, and street-cred is what the site is trying to sell.

The EW count they have there remains as was, not yet figured out! You go check it out. What is shown as the count for MN1 isn’t straight-forward on D1 timeframe. What I’ve labeled primary they labeled minor, and wha I have for minor they labeled minute. That can be worked around. Furthermore, what is labeled cycle I clearly doesn’t look impulse gauging the sub-waves (also censored). In the current supposed cycle III, pri[1] is at best labeled an expanding wedge, but I feel its sub-waves are rather ABC/333 than 12345/53535. I won’t be surprised if this count is broken later. That doesn’t mean their forecast upside target(s) isn’t spot-on for the pair.

These are the charts with my seasoning - we are at grand/super {V} bearish, cycle III with its pri [1] completed on 27Nov09, now in pri (2) its int©333 either not yet over or completed at las-week’s high. To get to the AF count, scale current cycle sub-waves one (or two) degree lesser. There’s an alternative count, but lets leave it at that for now?

For the IchiKH outlook, D1 close now shows a bounce off kumo/SSb, going up above/out of the grey (bullish), kumo depth shows high vlolatility; price action would have me trading that master candle with those reversal bars. On H4, viewing both close and bars shows bounces off two lines and KS, a group of reversals with break of that master candle to the upside, T/Ksens having crossed and kumo twisted (also bullish). The current reversal bars are playing off a stair bearish, figure that. If I were to take it, I’d play those three bars both ways – wait today London(s) and watching other $_ and _Y charts, take the side showing increase with volume. Might as well place a straddle 70p or 100p wide, or wait for it above 94.00 or/and below 92.60, once in, target 2R or hide behind h4Ksen/d1Tsen or half distance between, constant…you get the drift?

There are better symphonies playing at the pounds - why get thrown by such a wild pair? Both G$ and GY have EW counts looking terribly down, with E$ scrapping channel bottom looking up soon and EY waiting for it.


…96p from when I posted the chart to where it was yesterday.

Appreciate the insight, chizz!

Notice how it is near-impossible to tell exact wave degree off the AF things – they don’t talk of market-position like we are learning to do it here? There’s mention of minor degree, but I know there’s no ‘major’ degree. The classic labeling convention for the count isn’t done to the book, but just to show the five different degrees they choose to demonstrate with. Not that the person on the other side of that page doesn’t have his charts counted up to the whiskers, it’s just the free version. Armed with the right precision, one reduces the fake-outs from IKH, and improves the timing aspect (currently lacking here?) for wave ends/turns. To figure out exact exact (insert gesture here) wave degrees for the whole chart and label it:

It remains that the smallest waves which can be counted consistently in Elliot-mode, the very last full degree of count, is found on h1 timeframe charts as the basic wave building blocks. So I went looking for them myself on G$. I choose the corner at 17nov09 to start with, and since I had the other basic labeling it wasn’t hard to determine that what is rightly called minor degree is labeled with the Romans (i…v), actually used to label minuette but in this context was just to cluster waves of same degree together. It took me two days, can’t describe the whole process, but ended up with a new count on my charts every wave degree scaled down once. Here it is, this time going from the smaller frames up.


The current G$ wave position drilling up is minuette (iv), or minuette (v) starting, of minute [iii] minor 5 intermediate (5) of primary [C]. I might be one degree wrong, but it’s surely much better than what I had before, plus now I have a better notion of what duration each wave is expected to take. I’d appreciate it if someone would set up and eyeball the count to iron out a few bugs and nuances on h1, posting them next.

It should be noted that I still strongly believe in not trading lesser that h4 frame, as a matter of belief and convenience, but also because IKH doesn’t go lower, amongst other constraints stated before. Looks like I’m a little late in posting this…


Again from smallest degree drilling up, minuette (iv) minute [iii]’ minor 5’ was just over and minuette (v) started; sub-minute ii of minuette (v)’ had happened, and by the last post it was the start of third wiggle for sub iii bearish; I surely hope guys were able to catch that? It may sound too tangled up but believe me its easy to straight out once you start pinning your own count – as you might’ve noticed the last scales fell off my eyes totally with that walk?

Anyways, the ‘last degree’ is marked by i,ii…v,a…e, as seen on h1, on h4 the last order is minuette (i…v, a…e). Take the most current h1 attached, see the way one can see clear subdivisions of the sub-ii and current iii (we need a ref name for those). I took wave one of sub-iii and projected (orange fib) wave three bearish of sub-iii; it just touched 200%, next 261.8 looking like it will be wave three of iii of (v)’ of [iii]’ end. Wait for sub-iv retracement of sub-iii; projecting sub-i fibo (purple) from sub-iii start prospecting for sub-iii target; sub-iii just touched 161.8% and may have ended?
Or not to get off for the whole minuette till sub-v end confirms, around 100% proj of sub-i from sub-iv end for sub-v…we’ll cross those bridges early next week, oh we’ll know we’re there, we got the EW-map and IKH-compass? Would love it if someone came in with fibo timing? To see the GY, look through the same glasses for time being – GY doubles whatever G$ does for same lot size.

Now, about the finer details and bugs for the count on h1: I had meant to post a list of wave locations of count that aint very straightforward so guys can follow precisely where I’m coming from and to fix the two or so unresolved.
 At the start-point, minute [i] minor 1 intermediate (5) pri[c]; there are no visible sub-minuettes, so much for ‘the last degree count’ being on h1. try counting individual bars…
 Viewed on h4, minute [ii] minor 1 int(5) pri [c]; a running flat correction, rare variation of flat: but I figure such form fits here as disproportion caused by strong down-trending.
 Bearish sub iii minuette (iii) minute [v] minor 1; sporting a truncated fifth count both ways and doesn’t look like the schematic for an impulse, but what other better count is there? At least it meets condition of minuette (iv) of [v] not entering range (i) of [v].
 Sub v minuette © minute [a] minor 4 of int [5] pri c; some nuance, truncated/ orthodox sub-v because sub-iii has a wick above end of sub-v on bar/sticks, but h1close shows right look – one has to switch between the two views and h1 & h4 frames to get it right, that’s why it all has to be on same chart.
 Minute [i] minor 5 int (5) pri c; sporting the gap in week-open, minuette (iv) of [i] totally missing, I don’t know what happens here but hoping it doesn’t invalidate anything?

Enuff with the G$ for now, I have the new E$ count fresh out of the oven…


Consider the point [C] for the 1.6050 Jul’08 high on the mn1 for AF’s E$ outlook page: since they have all the data there is to have, I think the point is valid and should correspond to some end of a corrective wave up one larger degree which they didn’t mention, but we’ll have to come back up to that later in the posts.

I thing the best start-point would be in the current wave bearish to date from Nov09 1.50 high. When zooming in to h1, we are armed with the label minute for sub-waves one degree lower for current wave. I found out that what I would label sub-minuette corresponds with what would have been using the AF labeling. Credit goes to them always for providing the basis for our count. The only thing I achieve here is showing the detailed version.


Therefore, summed up, we are at minuette(v)ending/ended of minute [v] major 1 int © pri [A] cycle c super, though there are issues with the outer realm above minor. I think minuette(v) extended fifth of minute[v], just as in the pounds, isn’t over yet and doing its sub-iv&v of (v); or it just ended with minor 1 and currently we are doing the next minuette(i or a) of minute[i or a] of next minor 2 or something. Attributes to note here are: minuette(v) turning in the vicinity of 161.8% projection of [i] for [v]; the two h4 reversal bars bullish off 1.2250 support and testing h4Tsen resistance; distance from d1Ksen is 500p out of a possible 800p away and calls for return to equilibrium bullish; the swing-low’s position in relation to minor degree channel.

The short-term outlook would thus be geared to prospect and confirm [v] and consequently end of minor 1 bearish, and targets for the next minor 2 and its sub-waves On the downside, h1 already shows reversal bars, which could be a phony wave-bee of the current sub-minuette correction or wave-one of the next sub down; will watch for qualities of impulse wave, then wait for wave two same degree, and short wave-3. If it’s a wave-b gauging by overlapping bars and crazy wicks, wait for its end near beginning of a-wave same degree then long for wave-c. Wave cee will be harder to play (have to be on h1 & only two wishes max, 70 over 300p) than sub-minute v would be, if there will be a sub-v below current swing-lows on both Eur & Gbp charts. In short, like ICT observed there, a level is tested once, then either breaks or holds on the second, if it holds, watch for major movement in opposite direction. This is consistent with waves b right before c in testing start of a, and waves two in testing start of one right before wave three.

The correction for the whole minuette(v) is quite uncertain since its subs are not so clearly discernible to hang yet, the first target wound be h4Ksen, and further d1Tsen ; correction for sub-minuette iii could be targeted at its wave-four range, which is d1Ksen and .618 retracement of sub-iii.


Other consideration involves the degree of wave for the current bearish from 1.50, currently labeled minor1. Viewing d1, then end of current int[C] bearish would be at … so low. But see that: int(A) from 1.60 all-time-high to 1.250 unfolds in three abc-form minors, hinting for a completed flat primary[A] of cycle-c when int© is ended, and; viewing mn1, correction for pri[C] of cycle-b should be expected in range of its int(4). Could the minor1 be of same degree as int(A), i.e. int©. This would mean either revising the count on h1 & h4 counts for minor 1 (which shouldn’t be so since on h1 we are on the last count?) or changing the outer-realm counts to accommodate such development?

The longer-run outlook bit of it gets a twist in that it is not indicated which larger degree ends at aforementioned point [C], but since it pertains to above primary degree and current primary is four ints away, we won’t be needing it for sometime now except for point reference. The farthest point we know now would be after 1990 as shown on AF as still part of a corrective wave up for cycle degree, greater than primary[C]; we are in another corrective wave down, labeled as © part of a larger degree [A] stage decline. So the just ended cycle up at [C] would either be: cycle a bullish after a super-cycle degree decline either (I) or (III), which just cant be gauging from the age of the euro currency, or; cycle b bullish after a cycle a bullish, part of a three-wave super-cycle correction (II) bearish, inna-dis-a-grand. This thus places us inside a cycle c wave bearish. We can’t be inside super (IV), again gauging age of the pair only super (I) could have elapsed.

Therefore restating current market position, include that we are in cycle-c, b having ended at pri[C] all-time high.


Hi all,

Could someone help me clarify this:

Each of the three classifications of the TS/KS cross mentioned above can be further classified based on the chikou span’s location in relation to the price curve at the time of the cross. If the cross is a “Buy” signal and the chikou span is above the price curve at that point in time, this will add greater strength to that buy signal. Likewise, if the cross is a “Sell” signal and the chikou span is
below the price curve at that point in time, this will provide additional confirmation to that signal. If the chikou span’s location in relation to the price curve is the opposite of the TS/KS cross’s sentiment, then that will weaken the signal.

I am hopelessly lost. Could someone help clarify it on a chart please?

thats it dude

The basic reference for Ichimoku would be ichiwiki and there is the new advanced candlestix & IKH by ActionForex. I didn’t find those lines you refer to in either; where did you get them? The methods shown in these references are based on basic signals observable off the chart, and vary much according to trader interpretation.

My trades are based on h4 and d1timeframes. Draw the visual-aid line and set it; I used the h4 GY extreme point on 07Aug’09 to set the h4 line, visible only on h4, midpoint exactly on the right candle bar close and left point on chikou span. Listing the IKH signals somewhat in categories: price crossings (Price-Tsen cross, Price-Ksen cross, Price-Kumo break); IKH line crosses and twists (Chikou-price cross, Ten-Ksen cross, Kumo twist), and; IKH line s+r & equilibrium levels (count Chikou out, Tsen bounce, Ksen bounce, Sspan A&B support/res…). See that chikou is above price 26 periods back on both h4 and d1, that is it. Now let’s drag the line.

First significant h4 signals appear on 10Aug (PTsx, PKsx, TKsx, CPx ). Chikouspan just crosses below price 26 bars back, but our sell is early gauging that price would still have been above Kumo. On d1 this would be the very first signal PTsx (Price-Tenkansen cross) which would be a weak signal because other signals have not yet happened, like Chikouspan crossing below price 26bars back and price breaking below Kumo. On h4, if our trade exit is the earliest opposite signal PTsx, we’d exit 11 bars 250pips later. Then back in on 13 Aug, stronger sell signal this time below Kumo which has already twisted to bearish, Chikouspan belo price 26 bars back, rides for 16 bars 350p. On d1 same early trade running. On h4 major turbulence would breed at least one stoploss, but on d1 that wouldn’t show much? Then the real constellation of signals for d1unfolds… keep moving the line like that.

Other things to watch is d1 price distance from Kijsen and kumo. At some extreme 900p from Ks, price retrances to meet it some distance between. Price action has a way of sitting reversal bars wicks and closes at points on IKH lines esp. KSen: I take it to be the equilibrium line. If one maintains a serious EW count and precise Price Action/Bar Parterns analysis, notice that entry signals appear way before IKH shows the ‘strong’ signals – the wave is almost doing past half! Price doesn’t turn because of the ichi lines and thus isolated perspectives like Price-Chikou span cross fade in absolute significance, they rather make relative sense in the overall trade outlook. The best use I have for the lines is trade management for SL movement and second lot exits. The IKH signals confirm accurately trades taken off PA and EW, something which is hard to put in one post I think comes off experience in the various methods.

Chikou span and kumo position relative to price becomes tricky for back-testing still charts without the line because of the +/- 26bars shifts for those lines. Hope your question got answered.


For the GY, telling wave degree off the AF count is impossible at first glance, but it helps much to guide overall shape of count: one needs a pencil & paper to crack the count. On the AF gy EW count outlook webpage, checkout the count from 13Jul’09 labeled minor 3 ended, then bullish with intervening X up to labeled minor 4 end.

Between h4 & h1 on charts, look at waves from 08Jul to 10Aug09 then onwards to gauge the last order count, on h1 I figured to label the sub-minuettes as shown below. This then, by projection backwards to complete the count on h4, labels the intervening X as minute, and inserting W and Y minutes like in a real count. In Pretchers’ ‘The European Financial Forecast’ there is an example with a similar count on pg 2.


Therefore summing up current market position for the new count from h1 up, we are at sub-v minuette (iii) ending/ended, or sub-a minuette (iv) minute [iii] minor 5 int (3) pri [5], with these many conflicts in EW-sense, an alternative count would bear the same weight.

Anyone who eyes the count keenly will find the following bugs:
 The labeling by AF for the decline beginning 10 Aug is a wedge which is off-schematic for a motive triangle, which eventually broke no wonder it’s no-longer updated, thus I adopt a different count for now? Same difference down the wave though.
 Off the 08Jul’09 start, see sub-iii of minuette © minute [y] minor 4 int (3) pri [5]: its wave one not quite discernible; overlapping at two degrees sub & lower. But argument for the subs’ count at minuette ©: projecting sub-i of © from origin of ©, sub-iii ends at 2x, and sub-v at 3x projections, same as schematic; cant figure why volume peaks higher for both fivees than threees in subs-iii&v.
 Subs of minuette (i) minute [i] minor 5 int (3) pri [5] not quite visible/ puny compared to previous minuette © of [y]-4. Most admissible to kill overlapping, I figure it’s in line with corrective waves taking longer and waves one being usually shortest due to basing. Otherwise considering alternative count to balance the two minuettes?
 Sub-iii of minuette (iii) minute [i] minor 5 int (3) pri [5]: impulse with serious overlap of component wavees one degree in; attempt at rearranging subs of (iii) yields even crazier count; sticking with the current sub count, so long as last order makes EW-sense, ignore the disorder in it?
 Minuette (v) of minute [i] minor 5 int (3) pri [5]: it’s a wave (v) as seen by death of volume; sub-I shortest actionary, sub-iii 2.618 proj of sub-I from end of sub-ii, sub-v 2.618 proj of sub-iii from end of sub-iv, just like schematic for impulses with extended fifths?

Now drilling outward:
 The AF count matches up with mine at minor degree, look for key-word in web-page. Consider the length of minute [x] compared with other similar degree?
 On d1 at int (1) of pri [5]: the int quite short, the last two or three degrees of order not visible even on h1 of that wave location; compare to previous int © of [4]. Still admissible?
 Minute [i], minute [ii] and minuette (i) of [iii] all show fairly same duration, just wondering if in a different count they wouldn’t be of the same degree?
 I’m at a loss to figure out the wave which will end at minor 5: is it int (3) or int (5)? That part either gets sorted in an alt count, or goes under the carpet till next sweep. What about at the end of pri [5]?


The best alternative count in my view would be one which solves the most bugs: on d1 to count int© of pri[4] as ended on Jul’07 as before, but the fall from then to 20Aug as minor 1, minor 2 ended 01Nov, minor 3 ended 19Mar’08, minor 4 ended 25Jul, and minor 5 ended at all-time low of 25Jan’09, thus end of int (1) of (5) or [5] impulse bearish; bullish from then to 10Aug’09 minor A, current bearish from then to-date minor B of (A) or [1].

Attributes of this alt-count are: sorts out bugs 2,3,4,7&8 from the list; fibo r/ship for new int(1) of (5) or [5] – projecting minor 1, minor 3 is 1.618 proj from end of 2, minor 5 is 3x proj from end of 4 – not a strong inference though. However, it’s quite pre-mature to start posting diagrams for the alt count now, before the current count fails, but good to know that an alternative outlook is possible?

The shots shown are the rest of the higher timeframes for the count.


My market outlook for the week will have to make do with that sub-standard GY count for the time being, used together with prevailing G$ and $Y outlooks, E$ still leading the way and a big gap for EY market posn?

E$: On h1 and h4, ended minuette (v) of minute [v] minor 1, which is quite a significant turn; thus started minor 2 three-waves with int (A) and © either five-wave impulses components of larger zigzag minor 2, or three wave complexes components of larger sideways/flatish minor 2. Target for minor 2 end predicted for: 61.8% or there about correction of minor 1; wave four range one degree lower of minor 1, that is range of minute [iv] of 1, or; 1.3600 next strongest s+r or one of its shadows. First target for the bullish wave, minute [a] of 2, expected: in range of wave four one degree lower, that is not past range minuette(iv) of [v]-1, or; in range of wave two one degree lower, that is not past range minuette(ii) of [v]-1. Clearly no overlapping for first bullish sub-i, must be impulse part of minuette(a)? Outlook to catch sub-i end, avoid/survive sub-ii, not miss sub-iii coming up next. Therefore pair currently in four of sub-i, or sub-ii; projecting sub-i… IKH looking like bearish bounce off h4 SSb, but still below d1 Ksen, watching for bullish support and signals. Below 1.2300 start watching for bearish continuation.

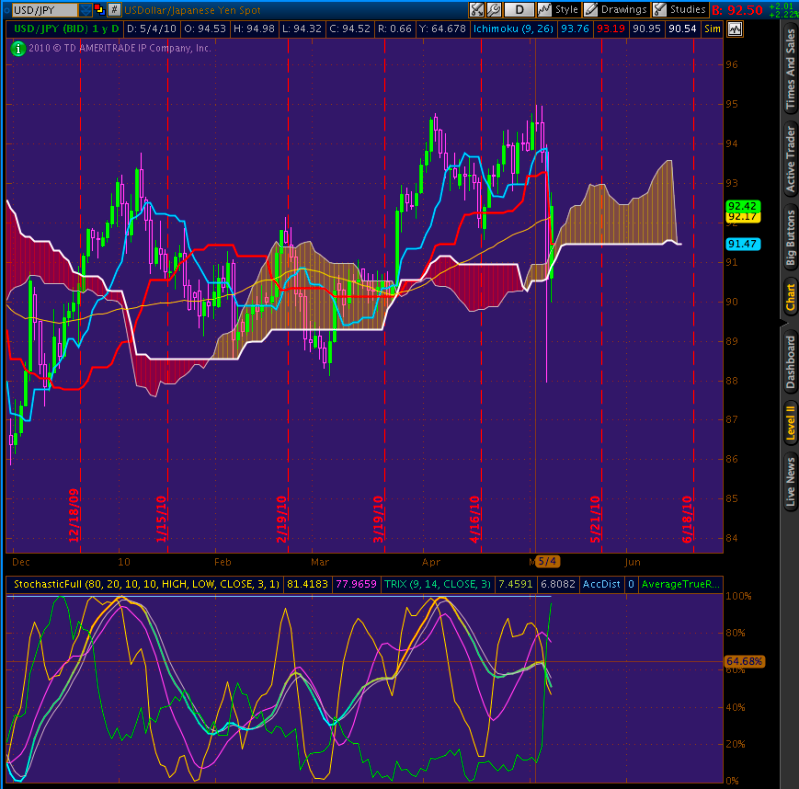
G$: On d1 just touched channel bottom far from eqbm looking up, on h1 and h4 sub-v of int(v) minute [iii] -5 just ended at 0000gmt 19May10, 21hr rise from there is three wave sub-a, sets pace for overall sideways minuette(a) whose first target may have hit with sub-c at wave four range one degree lower of prev (v) or yet to hit at wave two range of prev (v). Therefore currently pair is in sub-c of (a)’ ending/ended, now sub-a’ of (b) to bring more sideways bearish, then minuette© a must-catch bullish towards first target for [a] at prev (iv) of [iii]-5. Alternatively completed sub off 1.4530 is one degree lower, thus we’re in sub-a of (a) ending/ended, now sub-b of (a) to bring more sideways bearish, then sub-c, will be watching for range between 1.4300 on lower, and 1.47/1.50 on upper side. See h4 TKsx, d1far below eqbm.

GY: Gauging the leading pairs in my circle, I’m expecting bullish continuation for minuette (iv) minute[iii] minor 5 int(3) pri[5], up until G$ turns bearish and strong reversals on GY suggest (iii) isn’t over? Watching bullish h4 PTsx & PKsx, aiming for d1 eqbm.

For the record, last Thursday & Friday I wasn’t around so could do nothing about getting stopped out on both pounds, E$ managed to take off. Watching for London volume and bullish E$ h1 & h4 bars and I’m back in solid four pairs, kill the two under-performers by Wednesday? Swing with it, watch your hinges, keep your count up. Wish all o’yo great trading.


Can anyone help clarify?
What exactly is the chikou span?
If it is the current price why is it 26 periods back? I cant see it making much of a difference.
Also why mark S/R on the chikou if the flat lines of the kumo are good indicators of S/R?
But the main thing is why is it lagging behind 26 periods and not with the current price?

Thanks

Which ichi signals do you guys think would be best suited for an automated trading system? I’m reading the ichi wiki right now, and I can see that most of this is designed to be eyeballed and entered manually, though many of these could be solved programmatically.