I’m a fan of COT analysis : actually I love to study COT reports and positioning.
recently I subscribed to iCOT indicator where they introduce it as the approximate intraday COT chart.
As per the iCOT description : it is an intraday technical indicator trying to simulate and approximate COT reports.
tbh : I got amazed by how accurate to pinpoint major reversal points.
here I got screenshot from youtube video they introduce ( Webinar: Introducing the COTbase iCOT Intraday Indicator (10/09/2020))
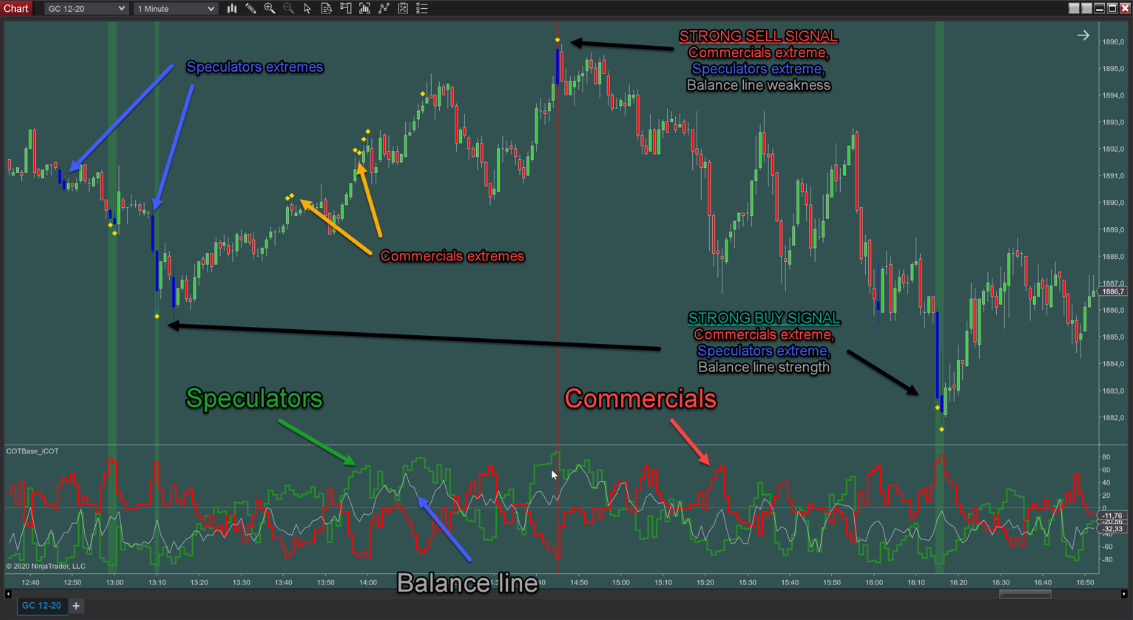
here a screenshot for how they measure extremes of commercial/speculators on intraday timeframes : you can google cotbase iCOT INTRADAY INDICATOR.
they seems to measure extremes in price based on commercial/speculators positioning.
i will keep posting charts for different symbols catching my eye.
If you are interested in any symbol : please ask and I will share its chart.
BTC Bitcoin reversals using iCOT indicator  I’m using iCOT intraday indicator since January to pinpoint major reversals in markets including Bitcoin.
watch youtube video about iCOT indicator.
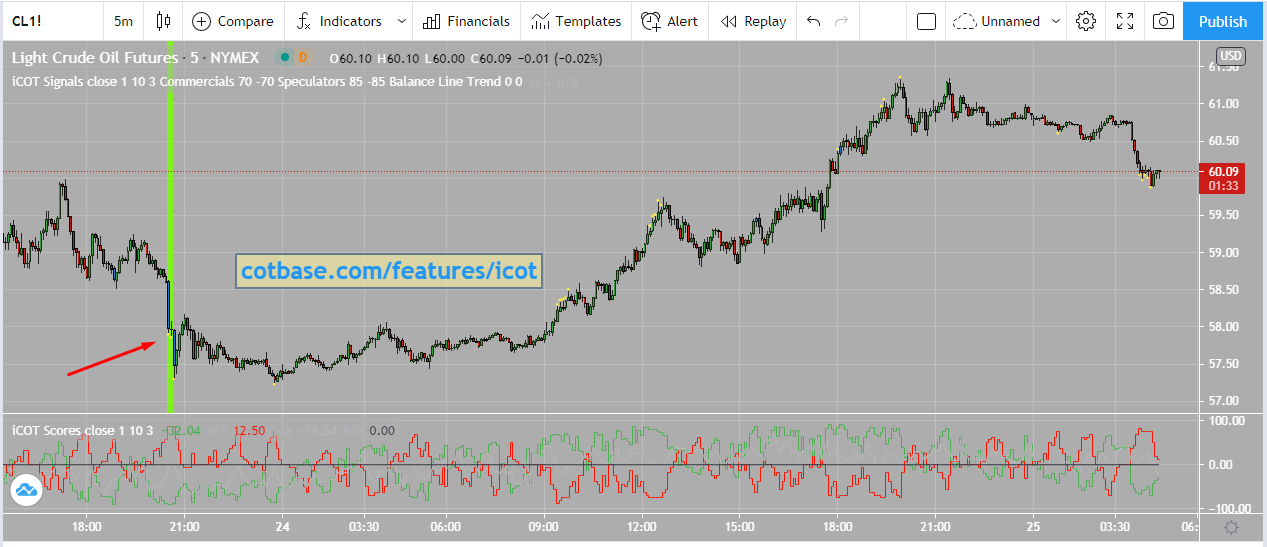
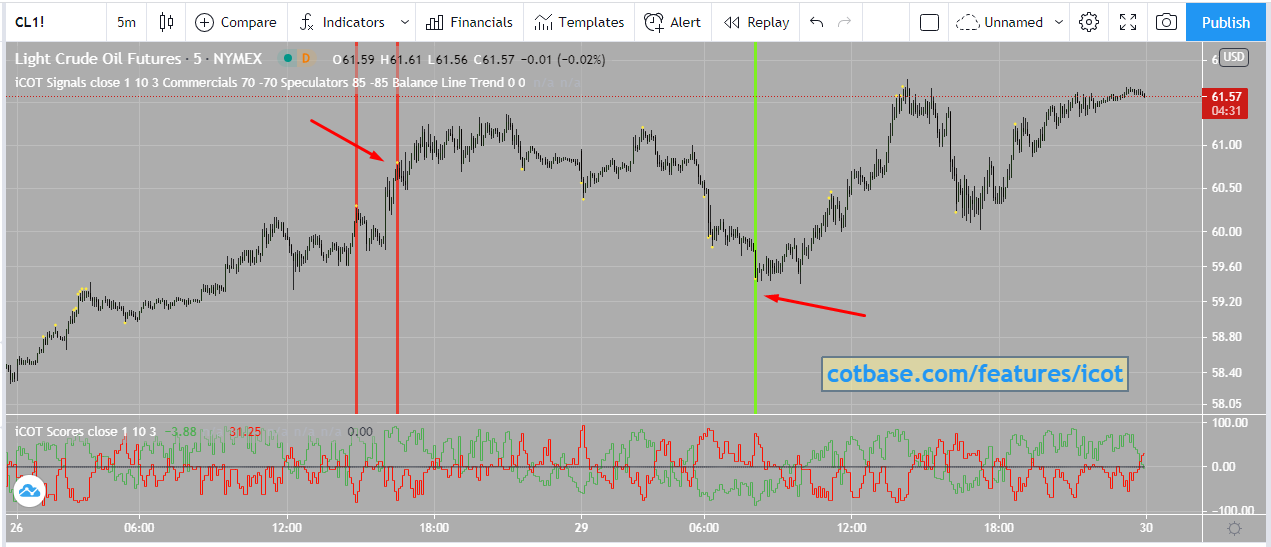
Reversal on CL $OIL
Yes : you can’t always be accurate but the risk/reward is good enough when using iCOT.
Love the COT and have been following the COT Base work for a while, I am a little sceptical that COTs can work intra-day, but I am going to watch the vid - thanks,
Am sure you will love the iCOT.
Am subscriber with their COT since 2016 and this new iCOT take it to next level.
Here is a trade I watching on bitcoin : yes of course not all times will work but it is 100% giving you excellent risk/reward.
real traderswill understand what i mean by “excellent risk/reward” and this is what iCOT is all about.
@COT_trader and @Johnscott31 You should look into FXCM’s SSI indicator. I’ve used it for years and it is prob one of the best signals out there. It’s something like 60-75% accurate at calling reversals (it’s a contrarian indicator)-- taken w/ some context.
here I was watching WTI Oil #CL : These reversals are the best for your risk/reward.
Watch their youtube channel about iCOT indicator.
iCOT measure extremes of commercial/speculators on intraday timeframes.
I was following SSI but iCOT really differs !
It is built on the logic of COT on intaday basis using price and volume.
Watch their youtube channel about iCOT indicator.
iCOT measure extremes of commercial/speculators on intraday timeframes.
Yes of course iCOT COTBase is not the holy grail ! nothing out there ! real traders will understand what i mean by
“excellent risk/reward” and this is what iCOT is all about.
Am just a subscriber with them : Am subscriber with their COTbase since 2016 and this new iCOT take it to the next level
for intraday charts.
iCOT differ as it tries to measure the extreme sentiment and commercial/speculators positioning of the market on intraday
charts.
Please have a look at this photo
For better understanding of iCOT : Please have a look at cotbase youtube channel about iCOT indicator.
here is the situation for bitcoin with iCOT on 3 min timeframes.
green/red strips are the most extremest sentiment.
For better understanding of iCOT : Please have a look at cotbase youtube channel about iCOT indicator.
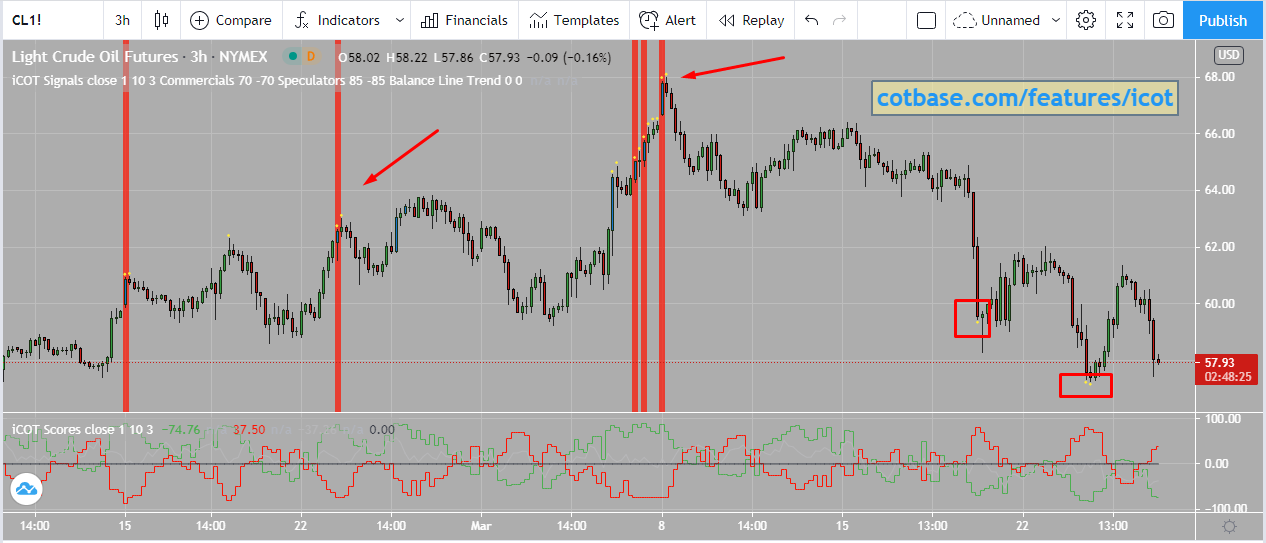
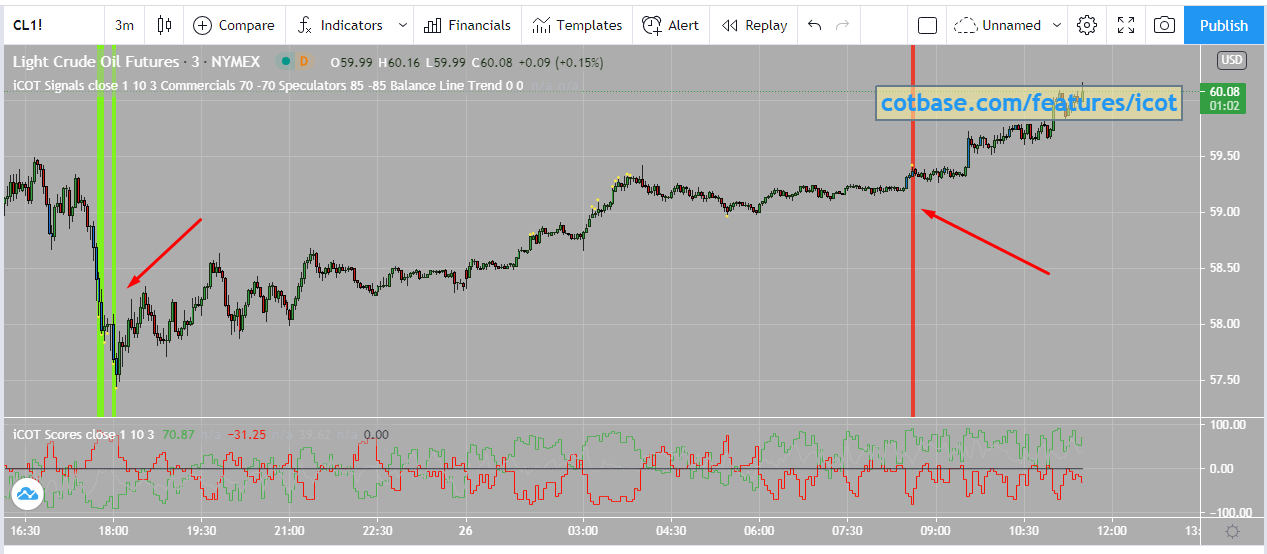
WTI $CL oil trade update using iCOT indicator
For better understanding of iCOT : Please have a look at cotbase youtube channel about iCOT indicator.
iCOT measure extremes of commercial/speculators on intraday timeframes.
Maybe you can answer this.
If the COT report only comes out once a week on Tuesday, how can this indicator show real time changes in positioning?
Not suggesting anything nefarious, but unless COTBase have access to exchange data no one else does, how is this done?
My apologies, I have not yet watched the video, maybe it explains how in that?
np john
cotbase answer this in the video.
plz check thier youtube channel.
$VIPS trade that iCOT cotbase could help you to manage in a real risk/reawrd !
Yes it is not the holy grail but for sure it help you to make it a winning streak of trades.
For better understanding of iCOT : Please have a look at cotbase youtube channel about iCOT indicator.
Here am posting current COT weekly update (week #12) with highlighted areas where most changes happened.
these changes in COT positioning means something going on in these symbols.
a look at WTI Oil chart today.
iCOT gave a green strip where extreme divergence happened between commercial / speculators.
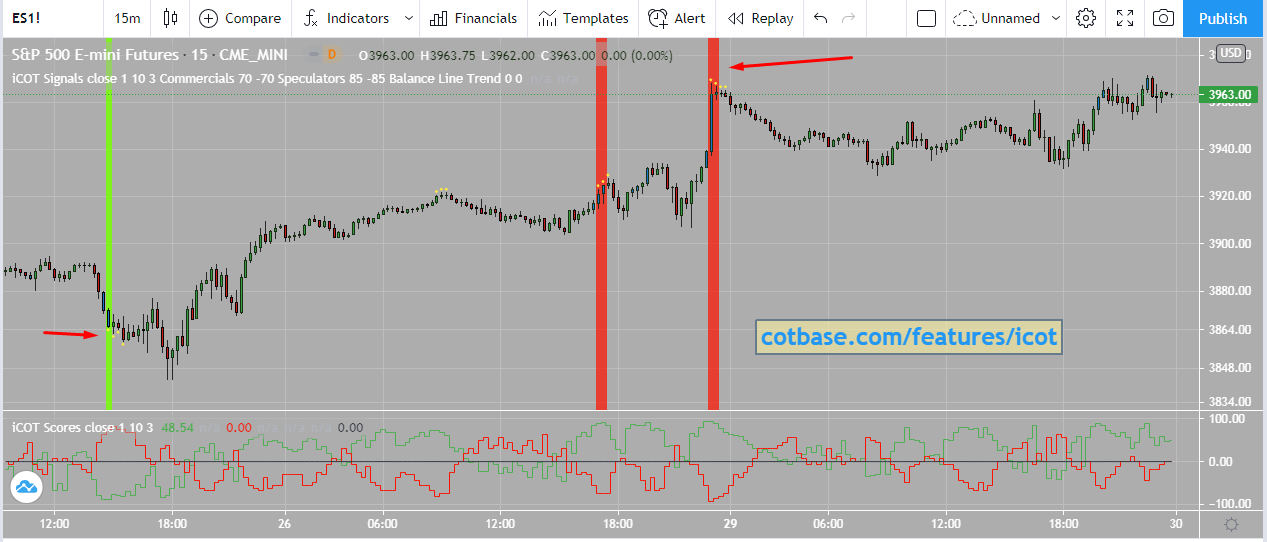
SPY chart : iCOT will let you join the flow at the extremist levels.
it will give you the most risk/reward advantage.
iCOT indicator created by reverse engineering COT data.
it is short term COT tool where extremes commercial/speculators divergence means short term trades.
Please watch their youtube videos this week.
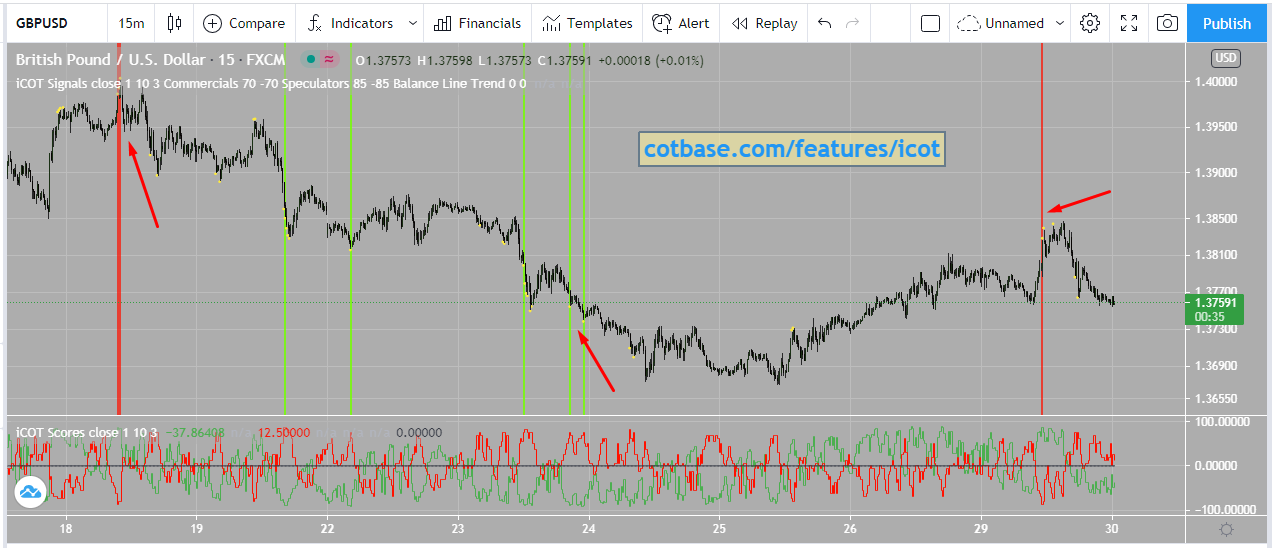
The strongest signals are the green and red vertical stripes (green = buy signals, red = sell signals).
Blue bars and the little yellow diamonds above and below the price are also sell/buy signals, but not as strong as the stripes. In special occasions, when consecutive stripe signals are observed, the escalation of the current trend is likely. Buy/sell signals are confirmed once the signal bar’s low (in case of sell signal) or high (in case of buy signal) is broken.
iCOT REVERSE-ENGINEERED COT DATA AND CREATED iCOT INTRADAY INDICATOR!
You can use the iCOT indicator on any chart type (eg. candlesticks, bar charts, renko, range bars, etc.) and time-frames (eg. 1-min, 5-min, 1-hr, 4-hr, etc.).
GBPUSD
iCOT will give you better idea for risk/reward.