ill take a look at the first Video, I’m not really a fan of ICT the guy talks way to long and claims he coded the markets XD ,However, he provides lengthy content which is good but, a lot of people have made a lot of videos on the guy. For me i try stay away from people who i know offer courses, I’ve been taught by experience and experiences from others that mentors and “guru’s” are generally fake, i wont go on too much though about ICT, i did used to be fascinated with his teachings of SMC, however, his ICT techniques are watered down from SMC and then romeo who claims 100% wr or 90% is also quite watered down, just my opinion though.
not saying the techniques dont work just saying the people who educate and put these videos out may not give people the best idea. I do like some of ICT’s teachings such as his RM vids.
i watched the video im confused however, You talk how FVG is IRL, but the guy is using a 4hr FVG and using swing highs as ERL on the same TF?? , i understand how the FVG lies within and inside the swing highs and lows but my persepctive of internal is using a LTF inside that HTF swing highs and lows.
Me personally i prefer to use swing highs and lows on a HTF as ERL and internally i also look at swing highs and lows. The difference is that im able to get a better view and understanding of potential directional bias when looking on a ltf compared to HTF that may only be showing a few sticks.
ERL and IRL are always shown in every timeframe. He is trying to say that one can plot the ERL and IRL (FVG) on HTF like H4 and then move to LTF like 15M or 5M TF. When the Price retests the FVG of H4/HTF, execute your trade within the FVG of H4/HTF at 15M/LTF.
Here is a snapshot of EURJPY H4, H1, and 15M TF chart showing H4 FVG respected on LTF.
@tomo22I noticed that the above screenshot created confusion because I only plotted the FVG on the H4 chart.
I assumed the members would check the Candlesticks on H1 and 15M TF, and will note that the Candlesticks of that time frame are much below the H4 TF FVG.
However, to clear the confusion I am again attaching the proper example of using FVGs from HTF to LTF. I hope the new chart will clarify the correct usage of FVGs and IFVGs.
i understand the first one quite clear actaully haha.
im not too familar with FVG and IFVG i know there use and how to apply but not to a full extent. i do understand the imagery though. This makes alot more sense thank you
only issue i have is with the FVG in terms of 4hr is that not external since you are marking the FVG on 4H TF? also isnt FVG only valid if it hits the 50% level of the rectangle (FVG)
hi @Sufshiken im having some trouble with locating ERL, how does it actually work do we just consider the current swing highs and lows as instant liquidity or do we have to be careful about selecting which swing?
perhaps if you could show me an example please thank you
this really depends on your definition of liquidity for isntance, for me i like to consider it as where past business was conducted meaning that targeting any specific swing high or low may not be the best because i want to look at areas where liquidity has been before, this is the issue im having with erl because im only look at previous swing highs and lows and where those lay.
im not sure if my definiton is wrong but if so please correct me
It depends on your trading style ( Swing or Day trading) and selection of higher, main, and low time frames.
I usually do day trading, I use H4 as my HTF, H1 as Main TF, and 15M TF for Entry and Exit. So I mark the last Liquidity areas as SSL or BSL on H4 and H1 TF. And use 15M TF for my Entry and Exit trade.
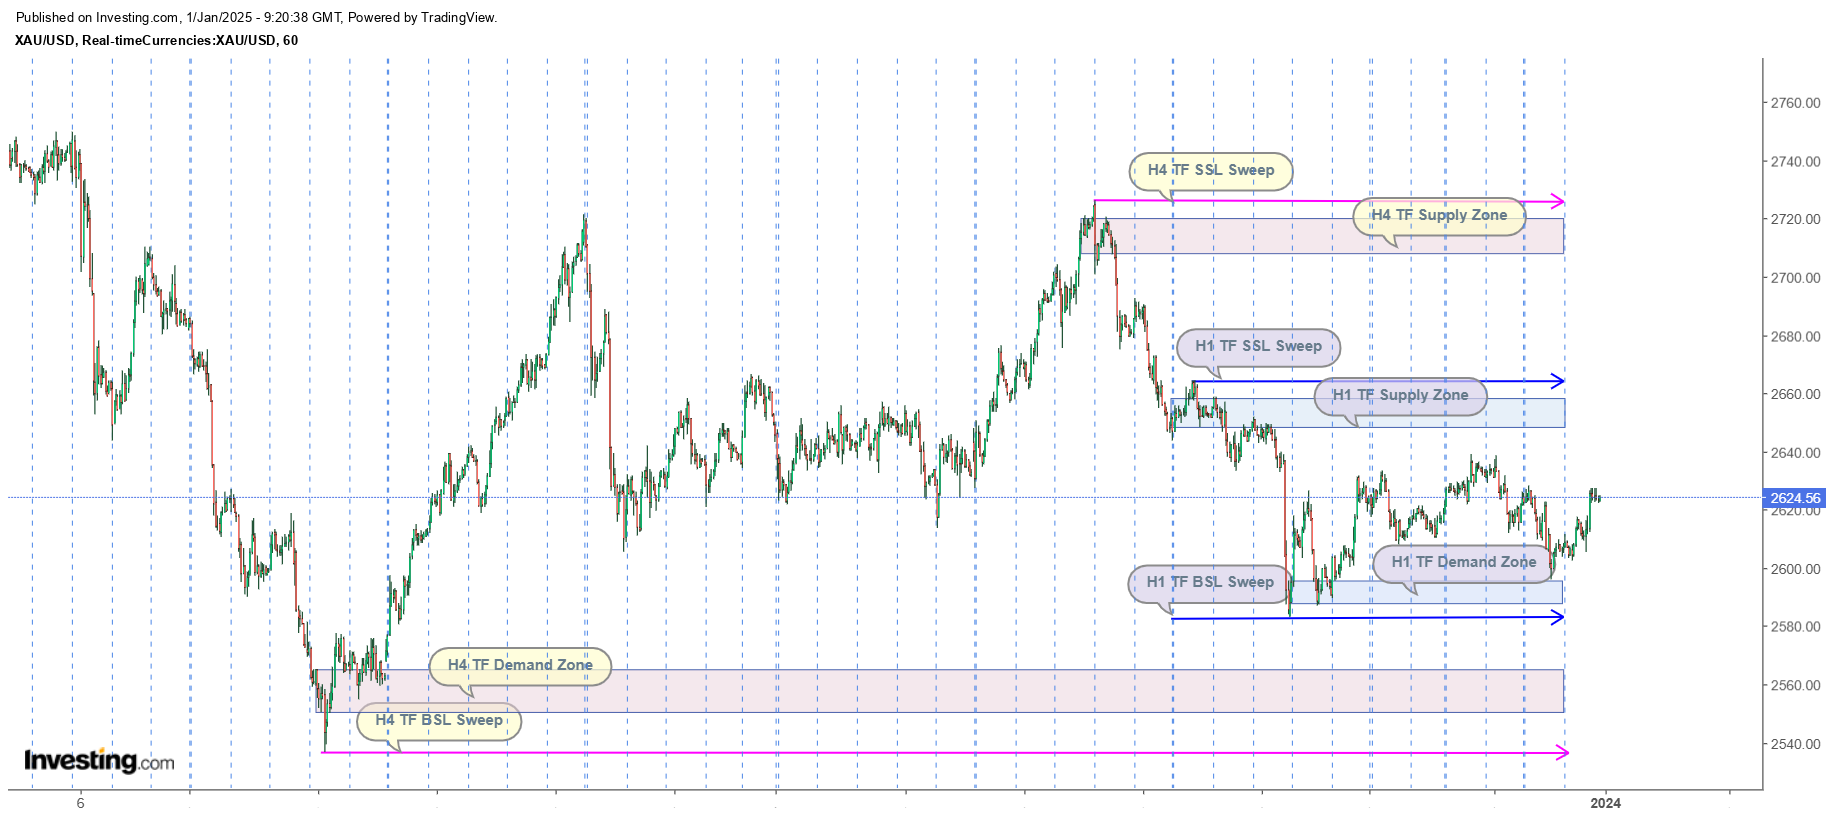
Sure, I am attaching two screenshots for your review. One shows the Liquidity Sweep and Supply/Demand Zones on H4 and H1 TF. The second is 15M TF, which shows HTF marking to trade accordingly.
This is my process of marking liquidity, perhaps other members might disagree with it.
@tomo22 Since you don’t prefer to use FVG as Internal Liquidity, you may consider HTF Supply/Demand zone as External liquidity and LTF SnD zone as Internal Liquidity.
Hope this definition would have clarified the ERL and IRL concepts now.
P. S:
Sometimes, the price doesn’t reach to SnD zones and trader may miss the trade opportunity.
The FVGs are drawn above the BOS/SnD zones, so there’s lesser chance to miss the trade.
hi @Sufshiken thank you for your time in putting these charts together. I like drawing to the perspective of others and i like the way you mark your zones. To be honest this seems very similar to using SnR externally and internally i would probably have marked my zones in the exact way you have.
i assume you would then mark your FVG in between the ERL on a 4hr/1hr tf and then move down to 15 min to execute that FVG entry?
however, i like the way you mark liquidity sweeps to show where stops have been triggered it is good to know that as a trader.
i wanted to ask what’s the difference between a liquidity zone and a SnR they seem very similar in where they are located, however, they have different definitions.
i wanted to ask what’s the difference between a liquidity zone and a SnR they seem very similar in where they are located, however, they have different definitions.
The Supply & Demand term is used for the areas where price retests more than once. Most of the times, these areas are formed near consolidation or in a rangebound phases.
Whereas ICT/SMC trading terminology defines Liquidity (buy-side, sell-side) or Liquidity Sweep/Run differently and it is marked as follows:
When a pin bar/rejection candlestick is formed either in a bullish or bearish trend, we mark the top or bottom of the pin as Liquidity Sweep and draw the liquidity range on candlestick resides on the left side (in a bearish trend) and on the right side (in a bullish trend)** ( left/right from rejection candlestick)***.
Some traders mark the entire left side candlestick as Liquidity (SSL or BSL). In contrast, others consider marking only the candle body with the lower or higher wick in a bearish or bullish trend respectively.