I'm thinking out loud as I begin to sketch out an analysis on gold using Ichimoku

Good morning everyone :slightly_smiling_face:
I believe the title of my post speaks volumes about the light-hearted approach you should take with the thoughts I’m about to share. These are the reflections of an aspiring trader who still has a lot to learn and a long road ahead. They may turn out to be right, or perhaps not. What matters to me is to proceed step by step, in a reasoned and well-argued manner (I hope), regardless of whether the market confirms them or not; after all, we must always keep in mind that the market is unpredictable.

I should mention that, as a new user, I’m afraid I’m not allowed to upload more than one image per post, so I’ll proceed in subsequent steps.

This morning I chose to take a look at the Gold daily chart “from a distance”. I find it useful to try to better understand what the market did in the past and what it is doing now. After all, Winston Churchill himself once wrote, “The farther back you look, the farther ahead you can see.”

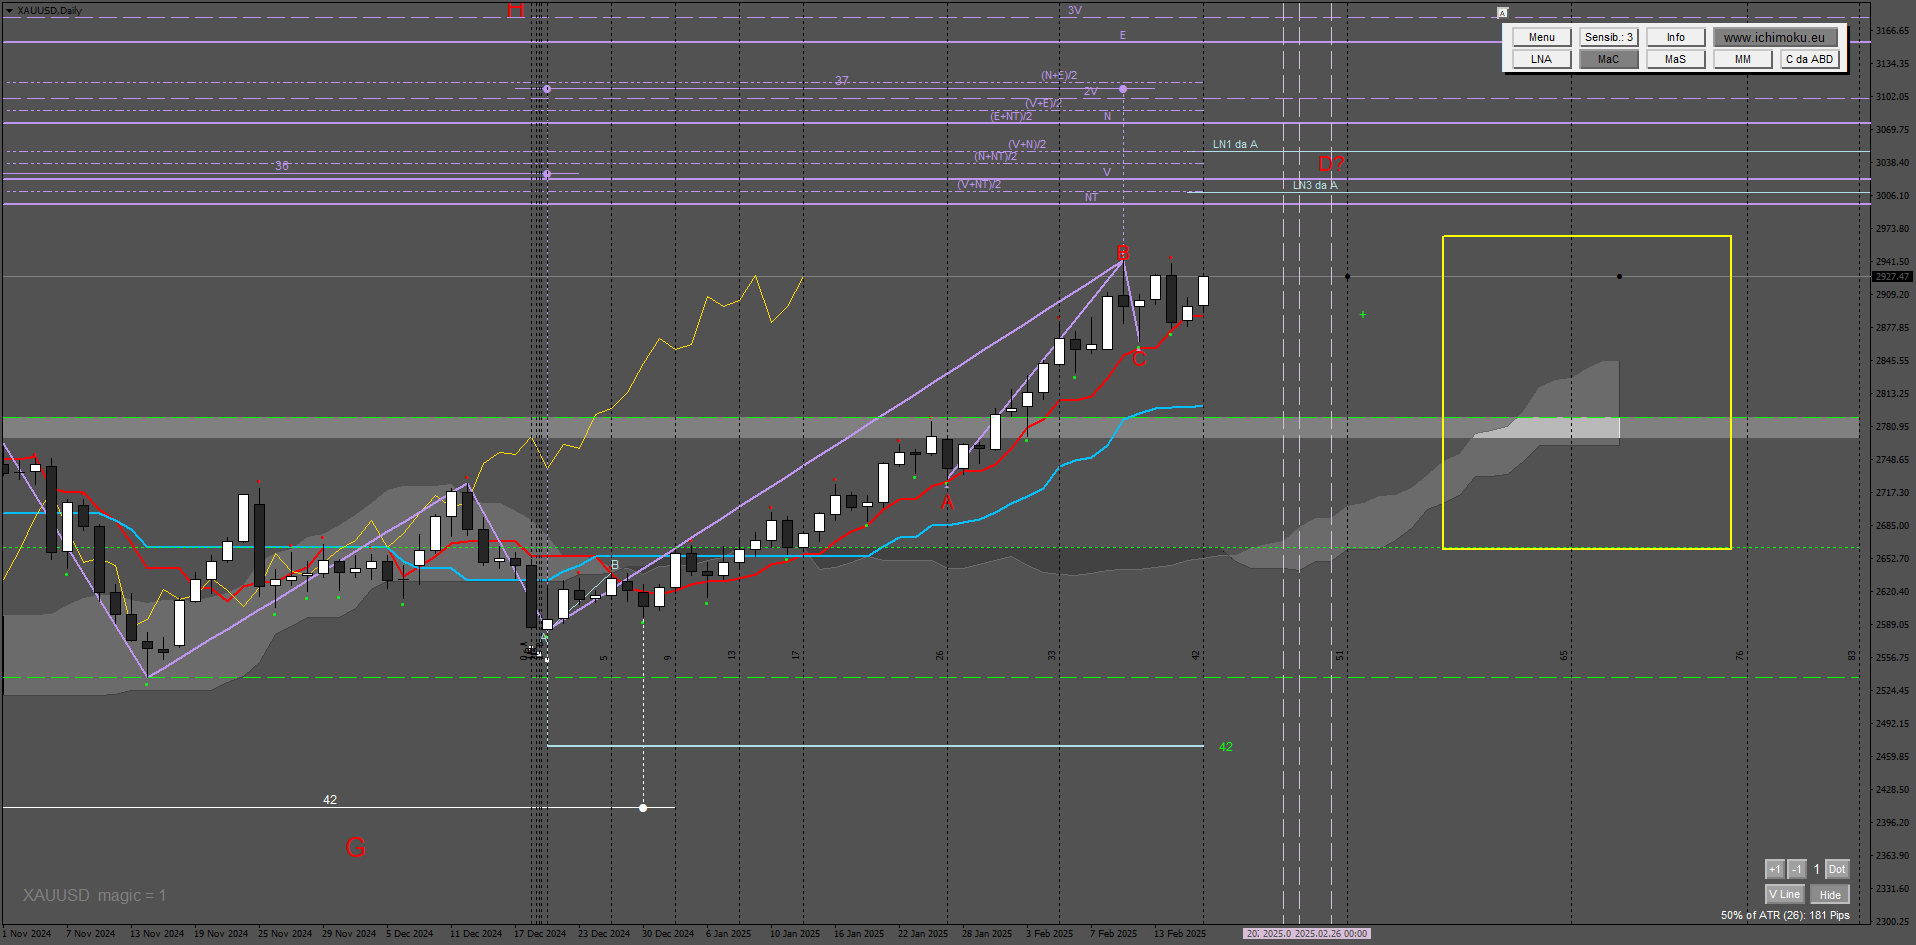
In this first post, I’d like to begin with this image.

As you can see, after surpassing the resistance area at around $2065, the price executed three directional moves. The number three is very important in the wave theory of the Ichimoku system. It is linked both to the number of moves that form what could be called “composite waves” (namely the N, S, Y, and P waves) and to the number of moves that comprise a trend. This concept is known as San Dan (3 stages), which is not very different from Elliot waves.

The number three is also significant in the context of Sakata’s Laws, conceived by Munehisa Honma, a Japanese rice trader from the 18th century, inventor of Japanese candlesticks, and a precursor to what is now known as price action (which inspired Steve Nison’s work and was previously praised by Ichimoku’s own creator, Goichi Hosoda).

To be precise, I haven’t yet got confirmation that the third move is complete. In future posts, I will share some of my thoughts on the matter.

I conclude by saying that a trend does not necessarily complete itself in exactly three directional moves. There could be more, as the market can be subject to particular conditions. A trader must always think in probabilistic terms.

I will continue with the next post shortly. For now, thank you for your attention and for any contributions you might wish to offer to the discussion.

2 Likes

Thank you @Didachos for an interesting and informative post!
Are you intending to also trade the daily TFs or will you be looking to place trades on a lower TF, say, 4H, based on the Daily analysis? E,g, waves within waves?

Good afternoon @SovoS, and thank you for your input! :slightly_smiling_face:

Ichimoku purists maintain that there is no need to use multi-timeframe analysis. This is because, in the days when Hosoda created the system, computers didn’t exist. Charts were drawn by hand and were therefore only rendered on a daily or weekly basis. Drawing them, for instance, on a 4-hour timeframe would have been too labor-intensive. Consequently, Hosoda designed his system to work on a single timeframe. Moreover, one of the fundamental pillars (and probably the most challenging and mysterious aspect to master) of the Ichimoku system is the theory of time. Since Hosoda created the system to function primarily on the daily timeframe, Ichimoku purists also claim that the theory of time works mainly on that timeframe and is less reliable on faster ones (1).

If Hosoda were alive today (2), he would probably have appreciated the technological tools we are fortunate to have, and he might have used them to adapt the system to a multi-timeframe approach.
I believe this because Hosoda’s entire work is characterized by Zen principles - such as the idea that one should not remain stagnant but be ready and open to change, much like water adapting to the shape of its container. Furthermore, a hallmark of Japanese culture is to absorb the positive and/or useful elements of other cultures and make them one’s own - not by copying, but by reinterpreting and improving upon them.
Unfortunately, we will never know exactly what Hosoda would have done.

That said, please forgive me - now I’ll finally answer your question.
Personally, I am not opposed to multi-timeframe analysis. Markets have two intrinsic characteristics: fractality and cyclicality. Once you have identified a very specific scenario on the daily timeframe, I find that seeking an entry on a faster timeframe can be a sensible approach. In truth, I must confess that both approaches have their pros and cons, as with everything. For example, in the context of the Ichimoku system, in my opinion:

  • Trading on a single timeframe has the drawback of a wider stop loss and a less precise entry, but the benefit is that it forces you to be patient and wait for a series of confirmations.
  • Trading with a multi-timeframe approach allows for a more precise entry with a tighter stop loss - yielding a more favorable risk/reward ratio - but on the downside, you are almost always trying to anticipate the market, with all the attendant risks. Moreover, on faster timeframes, you are more exposed to volatility potentially triggered by macroeconomic data or events.

As I always say, the important thing is to be aware of these aspects and adapt your trading accordingly.


(1) Personally, I have two objections to this thesis: the first is that if you identify a very specific scenario on the daily timeframe - thus applying the theory of time to that timeframe, which then serves as the context within which you act on the smaller scale of the lower timeframe (market fractality) - there is no need to apply the theory of time on that lower timeframe. The second objection is that even if you wanted to apply the theory of time to that faster timeframe to extract additional insights, most (if not all) of time theory principles would still hold true - especially regarding, for example, the so-called Taito Suchi, which are cycles based on identical numbers. If I, for instance, count a number of candles between a high and a low, and then count the same number of candles between that low and the subsequent high, what difference does it make if that count was done on daily candles instead of 4-hour ones? After all, they’re still candles.

(2) If I recall correctly, Hosoda died in 1982, and he published his work during the 1970s (after 40 years of research that began in the 1930s). This is to say that while computers did exist during his lifetime, we were still in the early days of computing.

1 Like

In this second post, I’ll begin to focus on the three price movements I mentioned in the previous post.

I hope the image is clear enough :slightly_smiling_face:

The first thing to note is the purple zigzag. These are the waves constructed based on the intersections of the Tenkan-Sen and Kijun-Sen (the red and light blue lines, respectively), what is known as the Kinko-Hyo. In fact, originally, Ichimoku consisted solely of these two lines.

There are several ways to trace the waves, and in my opinion, each method has its pros and cons. This is the approach I’ve chosen for now. As I continue my studies and research, perhaps one day I’ll change my methodology.

The second aspect to observe is the horizontal green channels, which correspond to the consolidation phases that the price experienced during its bullish trend—the ones I hand-drew in the figure in my first post. Notice that the median lines of these channels are positioned roughly at the same level where the Tenkan-Sen and Kijun-Sen themselves adopt a sideways trend and continue to cross each other. The Tenkan-Sen and Kijun-Sen lines represent the price’s equilibrium in the short and medium term, respectively. When these lines (with each other) and the price (with respect to the lines) keep crossing upward and downward, as happens during sideways phases, it means that the price is orbiting around its equilibrium level and is waiting to break out, thereby starting to move in a particular direction. If you think about it, these are essentially the same dynamics of liquidity accumulation and distribution described by Wyckoff.

The third point I want to examine is the extension of the three movements executed by the price. Taking into account the absolute lows and highs of these movements - as you can see from the two light blue lines, LN1 and LN2, and the purple line, LA1 - these three movements are not uniform in size, either in terms of price or time.

In the next post, I’ll continue with some thoughts on this last point.

Thanks again for your attention.

1 Like

In the last post we left off with the following issue:

The third thing I want to observe is the extensions of the three moves made by the price.
Taking into account the absolute lows and highs of the moves - as you can see from the two blue lines LN1 and LN2 and the purple line LA1 - those three moves do not have uniform dimensions, neither in terms of price nor in terms of time.”

What could I observe if, instead of measuring the extensions of the moves between their absolute lows and highs, I measured the distance between the median lines of the lateral channels I’ve drawn? The idea behind this is to measure the price range between one equilibrium area and the next.
I must confess that I’ve never tried doing something like this because it isn’t orthodox within the Ichimoku system, at least not based on what I’ve studied so far. It’s an idea that occurred to me this morning.

For the sake of better and more immediate visibility, I will use a rectangle for the measurement, which I will then copy and paste.

This is the result:

Interesting.

That’s all for this post. In the next one, I’m not yet sure which aspects I’ll examine. I will probably share some thoughts on the possible evolution of the Ichimoku lines, and if I find something interesting, some additional observations on these move extensions.

Thanks again for your attention.
See you soon! :slightly_smiling_face:

1 Like

Hello everyone :slightly_smiling_face:

So far, the analysis has mainly focused on what the price has been doing in the (more or less) recent past. Now I’ll try to offer some thoughts regarding the present and the near future. As I mentioned before, in this post I’ll provide a brief analysis concerning the price and the Ichimoku lines.

In the image below, I’ve labeled each Ichimoku line and you can also see some colored rectangles. There are three rectangles because, out of the five Ichimoku lines, three are known as Han-ne lines (which literally means “half price”) - namely the Tenkan-Sen, the Kijun-Sen, and the Senkou Span B. These three lines share the same mathematical formula:

(highest high of the last X candles + lowest low of the last X candles) / 2

The Tenkan-Sen is calculated over a period of 9 candles, the Kijun-Sen over 26, and the Senkou Span B over 52. Now, do you understand the rectangles?

These lines move for two reasons:

  • Either because the price reaches a new high or a new low (active movement);
  • Or because a candle, which had been providing a high or a low used in the line’s calculation, falls out of the group of candles in the X-period window due to the passage of time (passive movement).

As you can see, for example, at the close of today’s candle and the subsequent opening of the new one, the leftmost candle within the light-blue rectangle indicated by a light-blue arrow because it represents the lowest low of the last 26 candles - will drop out of the calculation, causing the Kijun-Sen to shift. In this case, it will move imperceptibly, but in other situations the movement could be more significant.

That said, let’s look at what the chart is telling us right now and what it might indicate in the coming days.

So, the price continues to find support on the Tenkan-Sen.
All the Ichimoku lines - with the exception of the Chikou Span - act as dynamic supports and resistances. The Tenkan-Sen, if the price doesn’t update either the high or the low of the last 9 candles, is still likely to rise a bit in the coming days.
The Kijun-Sen will rise either because the price updates its high or because, as candles drop out of the calculation, new candles with rising lows are taken into account, since it’s very unlikely that the price will update the low for that period. Consequently, as the Kijun-Sen rises, the SSA line (which is the average of the Tenkan-Sen and the Kijun-Sen) will also move upward. Meanwhile, the SSB will either rise if the price updates its highs or continue flat. On the other hand, the Chikou Span is well above and far from the current price, which means that momentum is in favor of the bulls in the medium term (1).

So, to summarize, what is the likely scenario?

The price still has room to rise. In fact, it has not yet reached an extension exactly equal to that of previous moves, and we must also consider the excess tolerance relative to the equilibrium level (but I’ll explain that in more detail in the next post).
The Tenkan-Sen and the Kijun-Sen could continue to rise a bit and, in the meantime, move closer together. Remember what I mentioned in previous posts about equilibrium?
The SSA and SSB might also continue to rise slightly together, or they could diverge (with the SSA rising while the SSB remains flat). Such divergence would result in a thickening of the Kumo (the resistance area between the SSA and the SSB), which could precede a potential retracement or consolidation of the price - albeit it could take some time to occur; however, this remains compatible with the scenario outlined so far.

For now, I’ll stop here. We’ll see what happens tomorrow. If possible, I’ll try to include some thoughts incorporating time theory.

Thank you and have a good evening.

(1) The Chikou Span is nothing more than the current price (to be precise, it connects the closing prices of individual candles), shifted 26 periods back. It’s essentially a momentum indicator. The mathematical formula for momentum relates a price change to the time over which that change occurred. The Chikou Span does exactly that, comparing the current price with the price from 26 periods ago.

… known to Western TA as Donchian channel midlines. :slightly_smiling_face:

I was very surprised to see you’re using the original 6-day-week settings: have you experimented with variations of them?

1 Like

Hello @Hiromi_Ishii :slight_smile:

No, I’ve never experimented with any variations.

However, I do know there’s a debate between those who claim that Hosoda set the indicator’s parameters based on the 6-day workweek in effect at the time, and those who argue that the indicator settings - and especially the Kihon Suchi numbers that form the backbone of the time theory - have nothing to do with the workdays of the week or month. Instead, they are the result of research Hosoda conducted over several years, combining Eastern numerology concepts (such as those derived from Buddhism and Chinese philosophy) with Western influences.

Hosoda carried out years of testing on historical data, trying various period combinations before selecting the values that produced the best results. It is said that the team from the research center he founded - which still exists - tested thousands of charts over several years before arriving at those specific numbers. The 9-26-52 settings are therefore the result of a synthesis between Eastern philosophy, mathematics, and the empirical observation of time and price interacting with one another.

I agree with this second group. From this perspective, I must say that I’m also a purist, and I confess I’ve never really questioned the matter much - also because in all the material I’ve seen so far, both Eastern (Fukunaga, Sasaki, Kei, and partly even Goichi Hosoda himself) and Western (among the few who strive to disseminate the true Ichimoku, such as Grzegorz Moskwa and Walid Bouchenafa), I don’t recall reading any references to workdays as an explanation for the origin of the settings or numbers (though I might be remembering bad :sweat_smile:).

Furthermore, consider that even after the shift to a 5-day workweek, the indicator’s standard parameters have continued to prove effective. This suggests that their efficacy wasn’t dependent on the workweek structure of the time. Some traders today adjust the periods (e.g., 10-30-60) to suit even 24/7 markets like cryptocurrencies, but the original settings remain the most widely used and, above all, the most historically validated.

Unfortunately, as you mentioned in one of your posts, Ichimoku is poorly and inadequately understood by many (and by that I don’t mean that I know it well). When Ichimoku was introduced in Europe in the ’90s, many Western traders dismissed it as an “exotic curiosity,” oversimplifying various aspects.

In any case, Hosoda often urges readers in his books to conduct their own research and experiment. I candidly admit that I haven’t followed his advice regarding experimenting with other parameters, especially because, in my opinion, doing so properly would require an enormous, statistically rigorous effort that one person would struggle to carry out seriously.

What do you think about this issue? Have you experimented with other parameters?

2 Likes

Good morning everyone :slight_smile:

In this post I will continue the analysis and add another piece to the puzzle - namely, the theory of time - and I will also try to better clarify the discussion about the extensions of price movements that I addressed in previous posts.

I’ll try to be as concise as possible to avoid boring you too much.

Put very simply: the theory of time seeks to identify the so-called Henka-bi, or “day of change,” by relating price movements to the time in which they develop. This theory is based on a sequence of specific numbers called Kihon Suchi (basic numbers), which you can find in the table at the top left of the uploaded image. Unfortunately, this table is not exhaustive. Some numbers are missing, such as 5 and 13 (although 13 appears as a tolerance for 17), or 51 (which would be part of those complex Kihon Suchi derived from the combination of simple Kihon Suchi, which are 9, 17, and 26). The number 51 would derive from 26 + 26 – 1 (we subtract 1 because that candle is common to the two 26-move segments).
For now, I won’t add more on the subject, simply to avoid boring you too much, though there would be a million things to say.

In the image below, I try to show what I believe are the relationships between the price movements and the time in which they occurred.

Explanation:

  • A: An upward movement that led to the first attempt to break through the resistance area at $2065 mentioned in my first post. This movement occurred in an N wave of 42 candles. As you can see, 42 is a Kihon Suchi.
  • B: A sideways movement following the first attempt to break the resistance. This movement took 51 candles. Again, 51 is a Kihon Suchi.
  • C: An upward movement that finally leads to the true break of the resistance. This movement took 42 candles.
  • D: A sideways movement following the first upward movement. Remember? First, the price is in equilibrium (sideways movement), then it breaks that equilibrium, which indicates a directional move. Once the strenght of the movement is exhausted the price returns to equilibrium (thus another sideways movement). In this case, the movement took 41 candles instead of 42, but it still falls within the tolerance.

In C–D, note that I have drawn the line LN1 connecting the low and high of that price movement. I will come back to LN1 shortly.

So far, you can see that there is a correspondence between the time, the meaning of the price movement, and the price movement indicated by the purple zigzag automatically drawn at the intersections of the Tenkan-Sen and Kijun-Sen.
If you recall, I mentioned earlier that this way of plotting the waves is not always perfect (and what is?). The fact is that in my opinion, a trader should not rely too heavily on automatic tools that give him a ready-made answer, but should always put in his own effort and reasoning.
If you remember, I concluded one of the previous posts by saying that there was no homogeneity between the extensions of price movements and time. For this reason, I had tried to verify the distance of equilibrium levels using those yellow rectangles.

Now I’ll try to see if I can resolve this critical point. Here is my explanation:

  • E: What develops in E is essentially still a sideways movement, as it does not lead to a true break of the green sideways channel. This price movement takes 42 candles.
  • F: An upward movement that leads to the true break of the sideways movement that developed in D and E. This movement took 64 candles. If you notice, 65 is a Kihon Suchi.

In F, note that I have drawn the line LN3 connecting the low and high of the impulsive movement that actually broke the previous equilibrium.
Now let’s compare LN1 and LN3:

  • LN1: A move of $465 developed in 68 candles
  • LN3: A move of $425 developed in 64 candles

They are not exactly identical, but it doesn’t seem too bad.

Let’s now move on to the final movements, where the situation is still difficult to precisely define because the developments are far from complete. I will limit myself to some superficial considerations.

In H you can see a first sideways movement that developed in 36 candles, from which the impulsive movement broke out, ending so far (I stress, so far) with a maximum at the 37th candle.
G represents an alternative hypothesis that tries to go beyond the automatic wave plotting, taking into account a different point for the end of the sideways movement and the beginning of the impulsive movement. As you can see, this point is positioned 42 candles away from the start of the sideways movement.

I will now address the final point and then stop boring you.
From the point indicated by a small lightblue “A” (I hope you can see it; in any case, it would be the point where the sideways movement ends according to the automatic wave plotting), I projected the extensions of movements LN1 and LN3 (those are the horizontal lightblue lines you can see in the top right).
From that same point, I started a real-time candle count, which currently indicates 42.
What is all this for? It is used to assess the possible development of the current movement, both in terms of price and time, compared to the other two previous movements.

That’s all for now.
Thanks again for your attention and, above all, for your patience.

Have a great day :slight_smile:

1 Like

Do you think next move will have a Kihon Suchi?

Thanks very much for such a fulsome reply, @Didachos. :sunglasses:

Yes, many - but not always in great detail, and not always with methodical enough backtesting and/or forward testing to draw reliable conclusions.

I’m in a different position from you, clearly, in that you’ve done a lot of “original source” research while all my information on this subject is really second-hand (even though it’s second-hand from institutional, formerly-institutional and Japanese traders!).

I successfully use Ichimoku to trade USD/JPY (just a pair that I happen to like,not for any other very compelling reason) and the Dax and Dow indices, but I use faster settings and have significantly improved my overall results by displacing the Kijun Sen line slightly forwards, which enables me to trail a manual stop loss more easily. (That part of things has been well backtested, etc.) I appreciate, of course, that I’m far from alone in doing this.

Good wishes for the gold trading!

2 Likes

Thank you, @Hiromi_Ishii :slight_smile:

I believe that it doesn’t really matter whether one uses the original parameters or modified ones, since what matters is the meaning and function of the lines - that is, to provide information on the state between equilibrium and price over a given period of time (1). Consequently, if someone wants to obtain different information, it’s perfectly fine to change the parameters, especially if it benefits them; after all, that’s the point: does what you experience differently from the original work for you? If so, then it’s all good. Trading is like a tailored suit that you have to sew to fit you perfectly.

I also have USDJPY on my watchlist. If you feel like sharing any thoughts, I’d be happy to read them.

Have a good day! :slight_smile:

(1) As I mentioned earlier, Hosoda himself encourages readers to do their own research and experimentation. Specifically, I recalled something he said regarding the Chikou Span. Hosoda notes that if, for example, traders want to have different informations about momentum information than that provided by the Span 26, they are entirely free to experiment with different numerical settings depending on the time frame they wish to consider. For instance, if they want shorter-term momentum information, they might set the Chikou Span with a shift of 17 or 9 (although he still recommends using Kihon Suchi). By analogy, if this applies to the Chikou Span, why shouldn’t it also apply to the other lines? The important thing is to do it knowingly.

1 Like

Hello @matthew88819 :slight_smile:

Please excuse me, but I’ll start with a quick clarification. You’re asking me about the next move, but I’m still focused on the current one. Based on the information I can gather at this moment (and I must stress that it might not be entirely accurate), my opinion is that the current bullish move is not yet complete and still has room to climb. That said, yes, one hypothesis is that this move could conclude in a number of candles corresponding to a Kihon Suchi, since we’ve seen in the past that the asset’s moves tend to conform to certain numbers. Another possibility is that the current move will unfold over a number of candles similar to that of previous moves. I’m referring to LN1 and LN3.

Having outlined a scenario on the daily timeframe, it now makes sense to shift to a lower timeframe, such as the H4, and start observing what is happening there in relation to the daily picture. It is on the H4 (or on other faster timeframes) that we might begin to see the first signs of what the price is about to do.

At present, on the H4 the price is clearly moving sideways, although it seems that something is in motion:

  • The Tenkan-Sen has crossed above the Kijun-Sen (indicating that the balance is shifting);
  • The Chikou Span is moving above the price from 26 periods ago (suggesting that bullish momentum could be gathering strength).

In the next post, I’ll share some more detailed thoughts linking the H4 and D1, and add further pieces to the puzzle.

I believe this post also addresses a bit better the question that @SovoS previously asked me.

See you later :slightly_smiling_face:

1 Like

Good afternoon :slight_smile:

In this post I will introduce price theory (or the theory of targets). In short, it’s about calculating the possible extensions of the C-D move based on the geometries of the ABC wave.
I’ll also provide some additional details about wave theory.

Remember when I mentioned earlier that the Ichimoku system features different types of waves? Well, the ones that interest us are the so-called N waves, because they’re the only directional ones.

The N waves are the result of three moves:

  • A-B (impulse)
  • B-C (correction)
  • C-D (new impulse)

All N waves are considered V waves (A-B + B-C) until they’re confirmed. Their confirmation comes with the break of point B - exactly the same concept as the BoS (break of structure).
In contrast, an N wave is invalidated when it is the C point that is broken.

Once point B is broken, meaning the N wave is confirmed, the task - as I mentioned at the beginning - is to calculate the possible extensions of the C-D move based on the geometries of the ABC wave.

There are four main possible extensions (or targets): NT, V, N, and E. Additionally, there are what we call intermediate targets. I won’t bore you with the calculations, as this is information that can be found quite easily online for those interested.

Now, let’s take a look at the same H4 chart I posted earlier, where I’ve selected an ABC wave (which hasn’t yet been confirmed) and its possible extensions for a hypothetical C-D move. Do you notice something interesting?

What I find interesting is that there are two intermediate targets that almost perfectly coincide with the LN1 and LN3 projections I mentioned earlier. See how a multi-timeframe analysis allows information from different timeframes to interlock like pieces of a puzzle?

And that’s just for the price movements; we haven’t yet considered time.

If you notice, the chart features three vertical lines labeled T1, T2, and T3. These timings, which represent possible temporal endpoints for the price move, are also calculated based on the geometries of the ABC wave. They constitute what’s known as Taito Suchi, a concept in time theory that deals with cycles based on identical numbers.

In the next post, I’ll show something interesting (at least in my opinion) about these vertical lines.

Before I forget, I also wanted to mention that I might take a look at what’s happening on the H1 timeframe, especially if the price does indeed begin to approach the upper part of the sideways channel, which corresponds to the level of point B that needs to be broken.

I hope I haven’t already reached the post limit for today eheh :sweat_smile:

So, to observe that interesting thing regarding the T lines drawn based on the H4 wave, we need to return to the daily timeframe chart.

You can see that the latest of these lines is positioned just one candle away from the projection of the Kihon Suchi 51, starting from the point where the current bullish move began. Notice how, even from a temporal perspective, information from different timeframes can interlock?

Now, all that remains is to see what the price does. I think I won’t have much to write for a while.

Until next time!

Good morning everyone :slight_smile:

As I mentioned in my previous post, if the price had approached the upper part of the sideways channel, I would consider switching to the H1 timeframe. This decision is driven by the desire to seek a trade that can offer a more favorable risk/reward ratio, in light of the scenario outlined in the higher timeframes analysis and the “spaces” indicated therein.

Here is the H1 chart.

Based on what the price will do in the highlighted area, I will decide whether or not to open a long position.

You’re diving deep into the charts! Do you look for these crossovers usually on H4 or combine them with other indicators?

Good morning @matthew88819 :slight_smile:

I don’t use any other indicators. As you may have seen, the Ichimoku system (by which I mean both the indicator itself and the application of its three theories) already offers numerous aspects worthy of reflection.
When I first started studying Ichimoku, I admit I used it alongside other indicators—such as the classic SMA50 and SMA200, the ADX, and the Stochastic (a typical Western modus operandi). However, the more I learned and understood about Ichimoku, the less I felt the need for these additional indicators, until eventually I eliminated them altogether. This perfectly illustrates the principle of “less is more”.

I must, however, make one clarification: Ichimoku doesn’t actually generate signals. For example, one should not buy merely because the Tenkan-Sen crosses above the Kijun-Sen or because the price breaks upward through the Kumo. These are simply events that have their own significance within the Ichimoku system and should be considered in relation to other elements of the system in a holistic manner. Consequently, the notion of a “signal” understood as “if A happens, then do B” is an oversimplification in Ichimoku that can lead to serious mistakes.

To compensate for this “lack of signals,” some Ichimoku users - even experienced ones - apply the system only on higher timeframes, while when they drop down to lower timeframes in search of an entry, they substitute Ichimoku with other indicators, such as Bollinger Bands, or with other techniques that provide them with signals.

Far from considering myself an expert, I personally do not feel the need for that; for now, I stick to using everything that I have managed to understand about Ichimoku through studying and research, along with observing price structures. And in doing so, as you may have seen from my posts, I don’t necessarily restrict myself to using H4; I also allow myself to drop to even lower timeframes when I deem it appropriate based on the context I have outlined on higher timeframes.

Good morning everyone,
I am resuming the analysis from the last post in which I mentioned that I would assess what to do based on what the price would do in the area indicated by the orange rectangle.

As you can see, once the price approached the upper part of the lateral channel identified in H4, which also corresponds to point B of the ABC wave identified in H4, it continued to trade sideways until, a few days ago, it started to drop, reaching the lower part of the lateral channel and violating point C of the H4 wave, thereby invalidating it.

For the sake of intellectual honesty, I must admit that when the price appeared to have broken through the upper part of the lateral channel and point B of the H4 wave, I opened a long position which, unfortunately, I had to close at a loss. I made some mistakes that will be the subject of reflection in the next post.

Here are the first mistakes that come to my mind:

  • FOMO: I conducted an analysis in which I hypothesized that the asset still had room to rise (and I still hold that view), but I became impatient for fear of missing the opportunity.
  • I attempted to catch the famous “falling knife” (even though in this case we were talking about a rally). And I’m not referring to those silly (in my opinion) remarks often heard claiming that “since the price has moved so far, it must necessarily retrace or reverse.” I mean that, for example, I traded without first waiting for a price structure that would have indicated a genuine statistical advantage - such as a breakout of the lateral channel followed by a retest. Instead, I only experienced a breakout - actually, more than one - that turned out to be nothing more than false breakouts. In short, I received plenty of warnings, yet I ignored them. And this should suggest that I still have work to do on both the technical and psychological fronts.
  • I did not give due consideration to two analytical factors: the first, perhaps less important because it was based on my own personal and somewhat unorthodox observations, was that on the D1 timeframe - as shown in previous posts - the price had essentially already reached its hypothetical equilibrium level. The second, certainly more important because it is based on one of the principles of the Ichimoku system, was the fact that on the W1 timeframe the gap between the price and the Tenkan-Sen and Kijun-Sen lines indicated a significant imbalance that could at the very least lead to a pause in the price trend (easier to say in hindsight).

For now, no other mistakes come to my mind, and I am only considering technical analysis. I am deliberately leaving aside any fundamental analysis considerations that may have contributed to this week’s decline.