Impact Silver. Another Jr metals producer and explorer that has a great looking chart, and what looks like, a triple nest. If the nest is correct, then the upside on this stock may be very lucrative. Impact Silver has a fairly clean chart, but again keep in mind, it is penny stock territory. This chart has more history to it than some others. And as mentioned above, from the low in 2016, the structure supports a possible triple nest.
Again, important to remember, that these miners follow the spot metal markets, Gold and Silver. So the primary expectation is for the miners to rally along with gold and silver, after the metals have struck a low.
We are going to take a look at chart in a couple of different time frames. This is an OTC ticker for USA markets, the Canadian Symbol is $IPT and trades on the TSX Venture exchange in Canada. The Canadian chart will have different pricing, but the structure will be the same.
Impact Silver Elliottwave Weekly View:
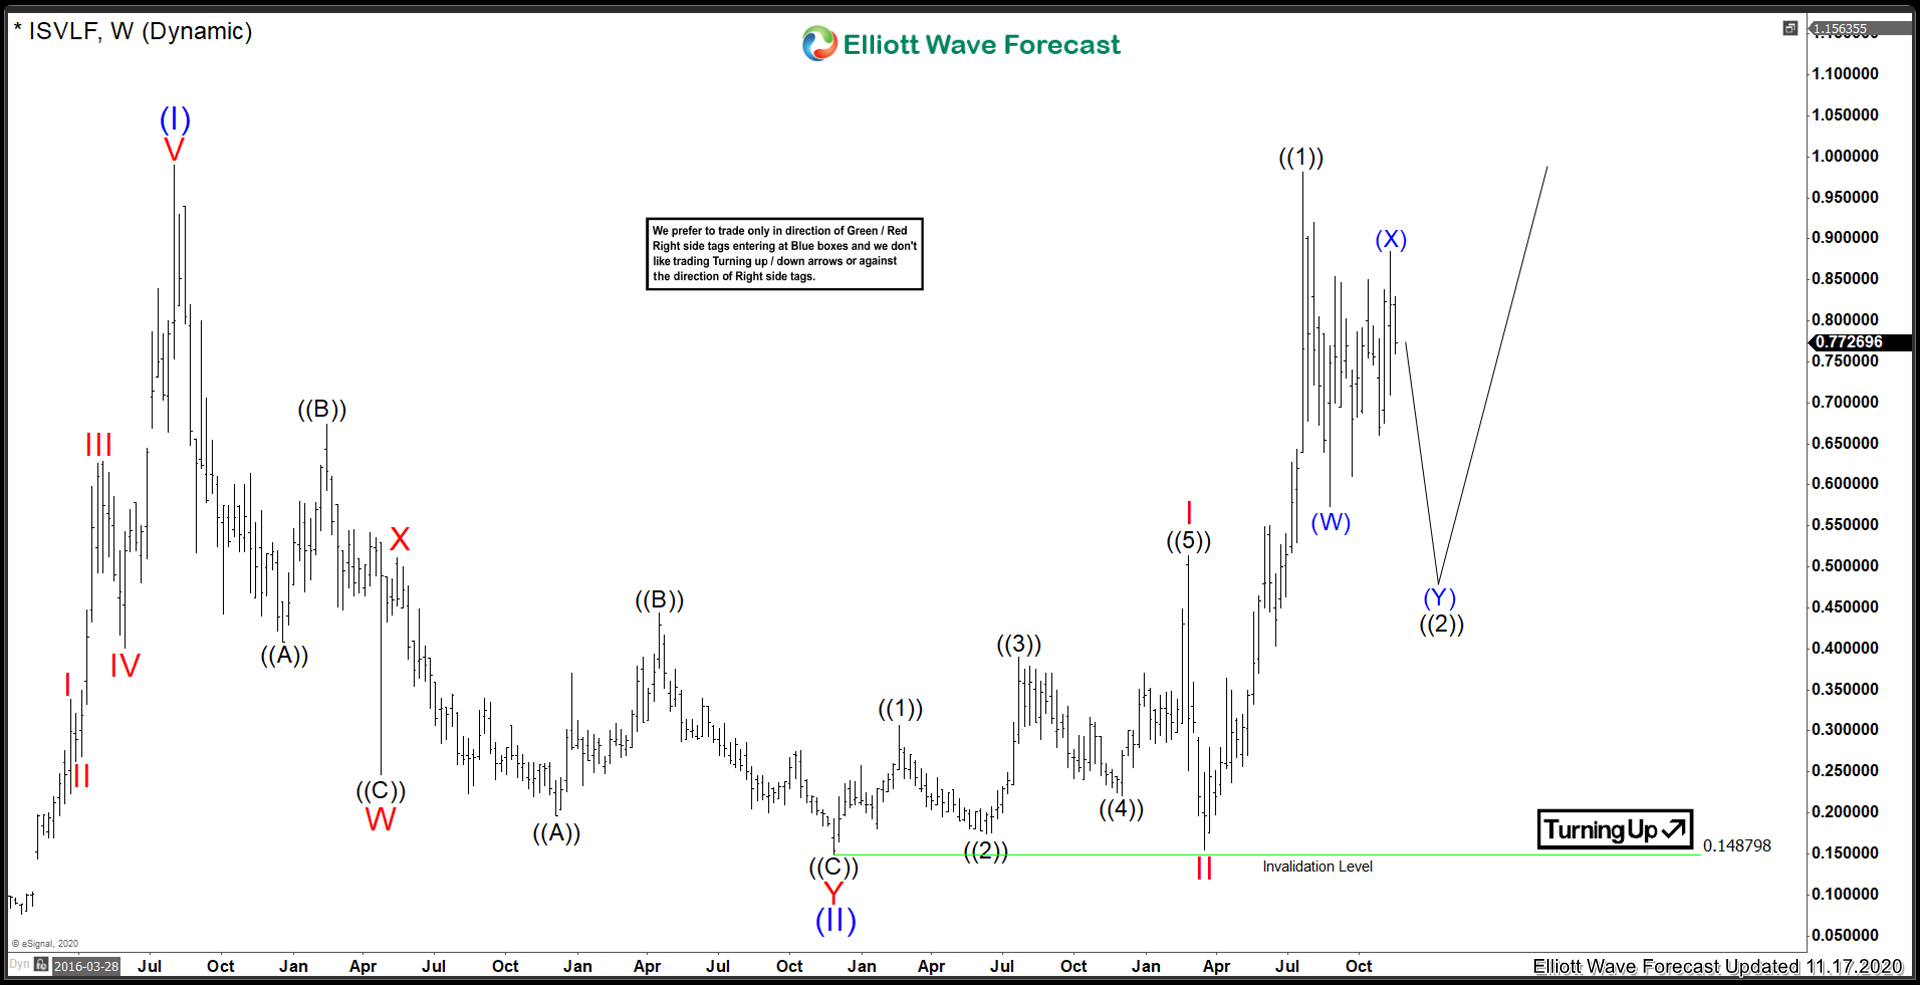
When looking at this stock on a weekly time frame, it aligns well with the GDX ETF. Impact silver set a low in Jan 2018, at a price of 0.07. From there, it has 5 waves up into Blue (I), which peaked on August 1st, 2016. After that, it has undergone a multi year consolidation, which ended in Blue (II) low in November 2018, at a price of 0.148. From there, another nest in Red I and II are complete, and most recently, further nesting in black ((1)) and ((2)) is favourable. Lets go a bit more in depth on the daily view.
Impact Silver Elliottwave Daily View:
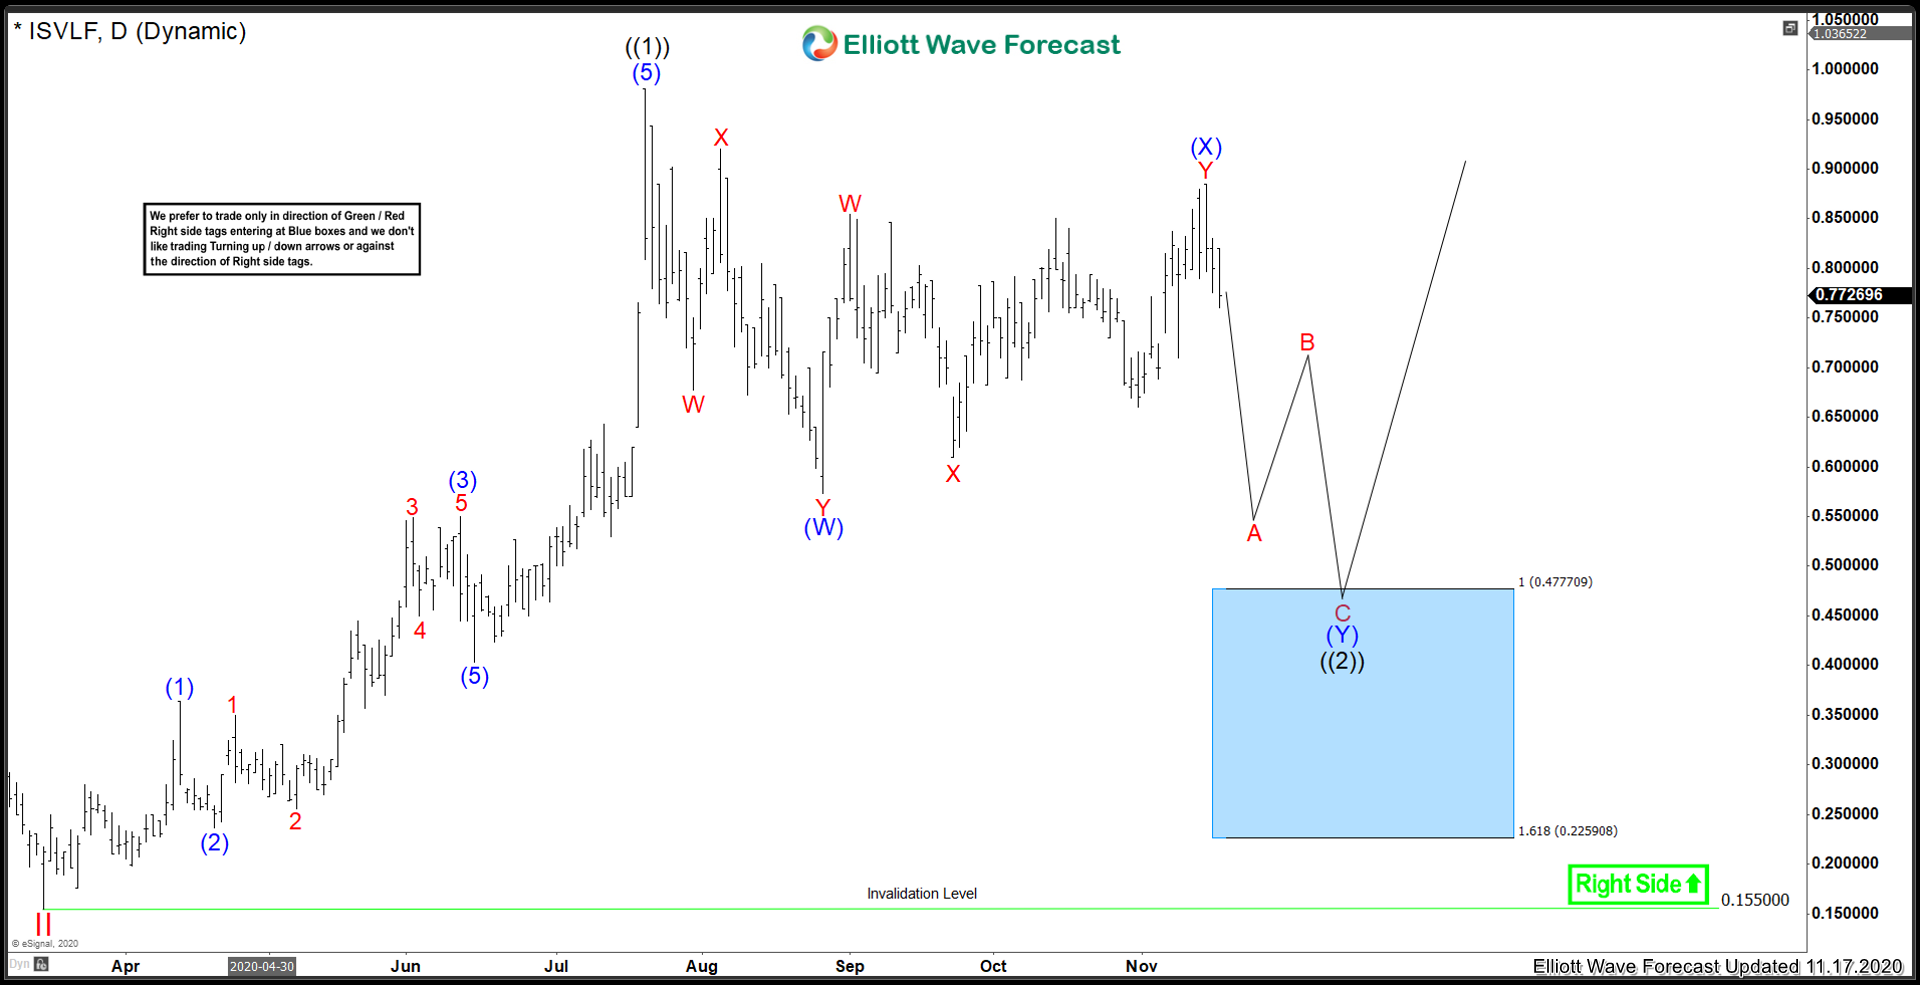
On the daily view, this stock enjoyed a very respectable 630% gain from the 0.155 low Red II in March 2020 to recent July peak ((1)) at 0.98 . Since then, it is favoured to be correcting in a double correction.
Since the March 2020 lows, the count is showing a clear impulsive structure into the July Peak. As mentioned above, our current expectation with gold and silver, is that there is still more downside possible. With this in mind, I am looking for lower prices still on this stock. There is a blue box extreme where buyers may show up for a bounce in 3 waves at least. This area is from 0.477 to 0.225.
In conclusion, this stock seems to be tracking Silver, more than Gold. And really started to outperform when Silver broke out above $19. Presently, the chart is still favouring one more swing lower in a double correction. As this is a penny stock, it is important to use proper risk management. The technicals on this chart are fairly clean, and I favour the price structure to track silver closely until silver sets a low also.
Risk Management
Using proper risk management is absolutely essential when trading or investing in a volatile stocks. Elliott Wave counts can evolve quickly, be sure to have your stops in and define your risk when trading.