Hello fellow traders. In this technical blog we’re going to take a quick look at the Elliott Wave charts of INDU. As our members know INDU has recently given us pull back against the March 18058 low. Pull back unfolded as Elliott Wave Zig Zag Pattern. We expected buyers to show at the Blue Box , calling for rally toward new highs or in 3 waves bounce at least. In the further text we are going to explain the Elliott Wave Pattern and the Forecast.
Before we take a look at the real market example, let’s explain Elliott Wave Zig Zag pattern.
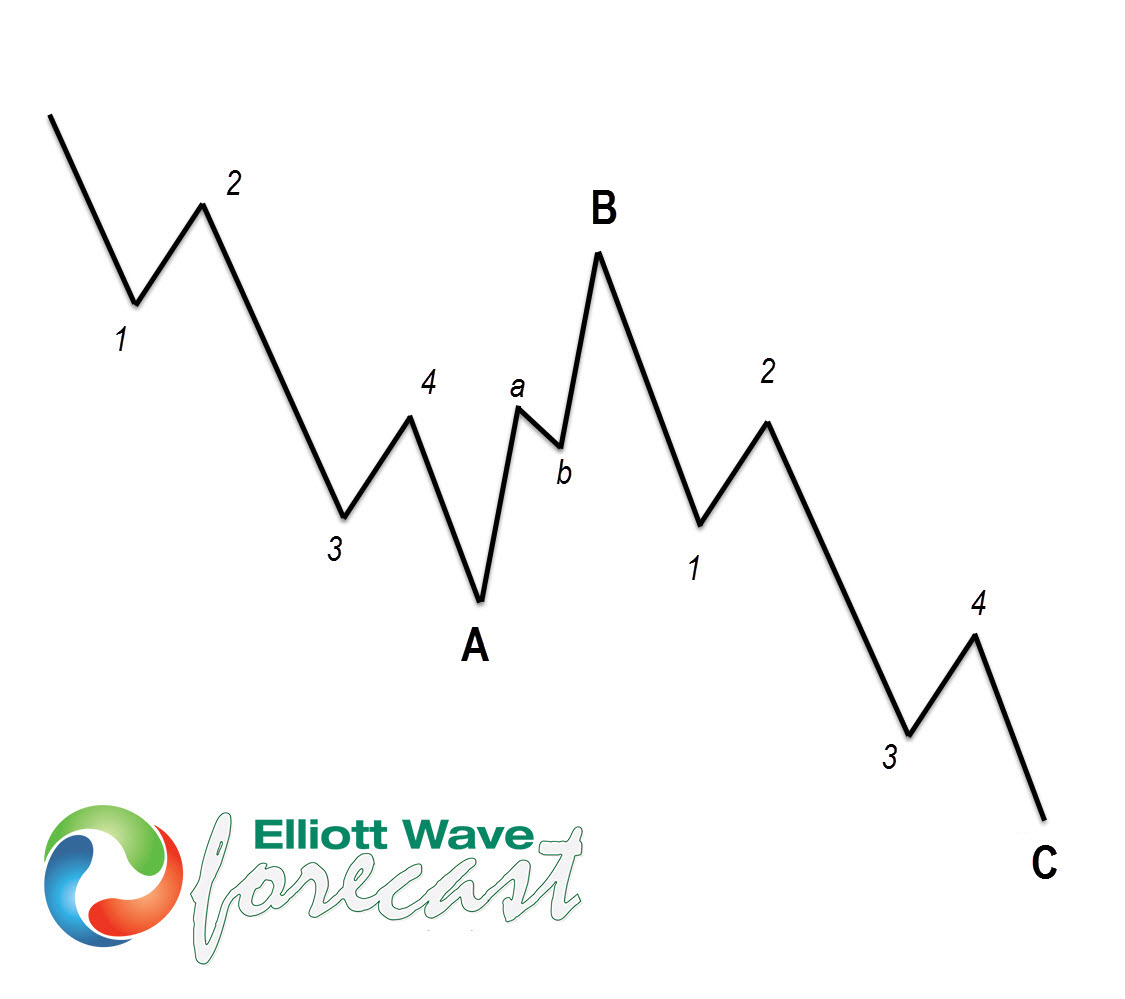
Elliott Wave Zig Zag Pattern
Elliott Wave Zigzag is the most popular corrective pattern in Elliott Wave theory . It’s made of 3 swings which have 5-3-5 inner structure. Inner swings are labeled as A,B,C where A =5 waves, B=3 waves and C=5 waves. That means A and C can be either impulsive waves or diagonals. (Leading Diagonal in case of wave A or Ending in case of wave C) . Waves A and C must meet all conditions of being 5 wave structure, such as: having RSI divergency between wave subdivisions, ideal Fibonacci extensions and ideal retracements.
At the graphic below, we can see what Elliott Wave Zigzag structure looks like. 5 waves down in A, 3 waves bounce in B and another 5 waves down in C.
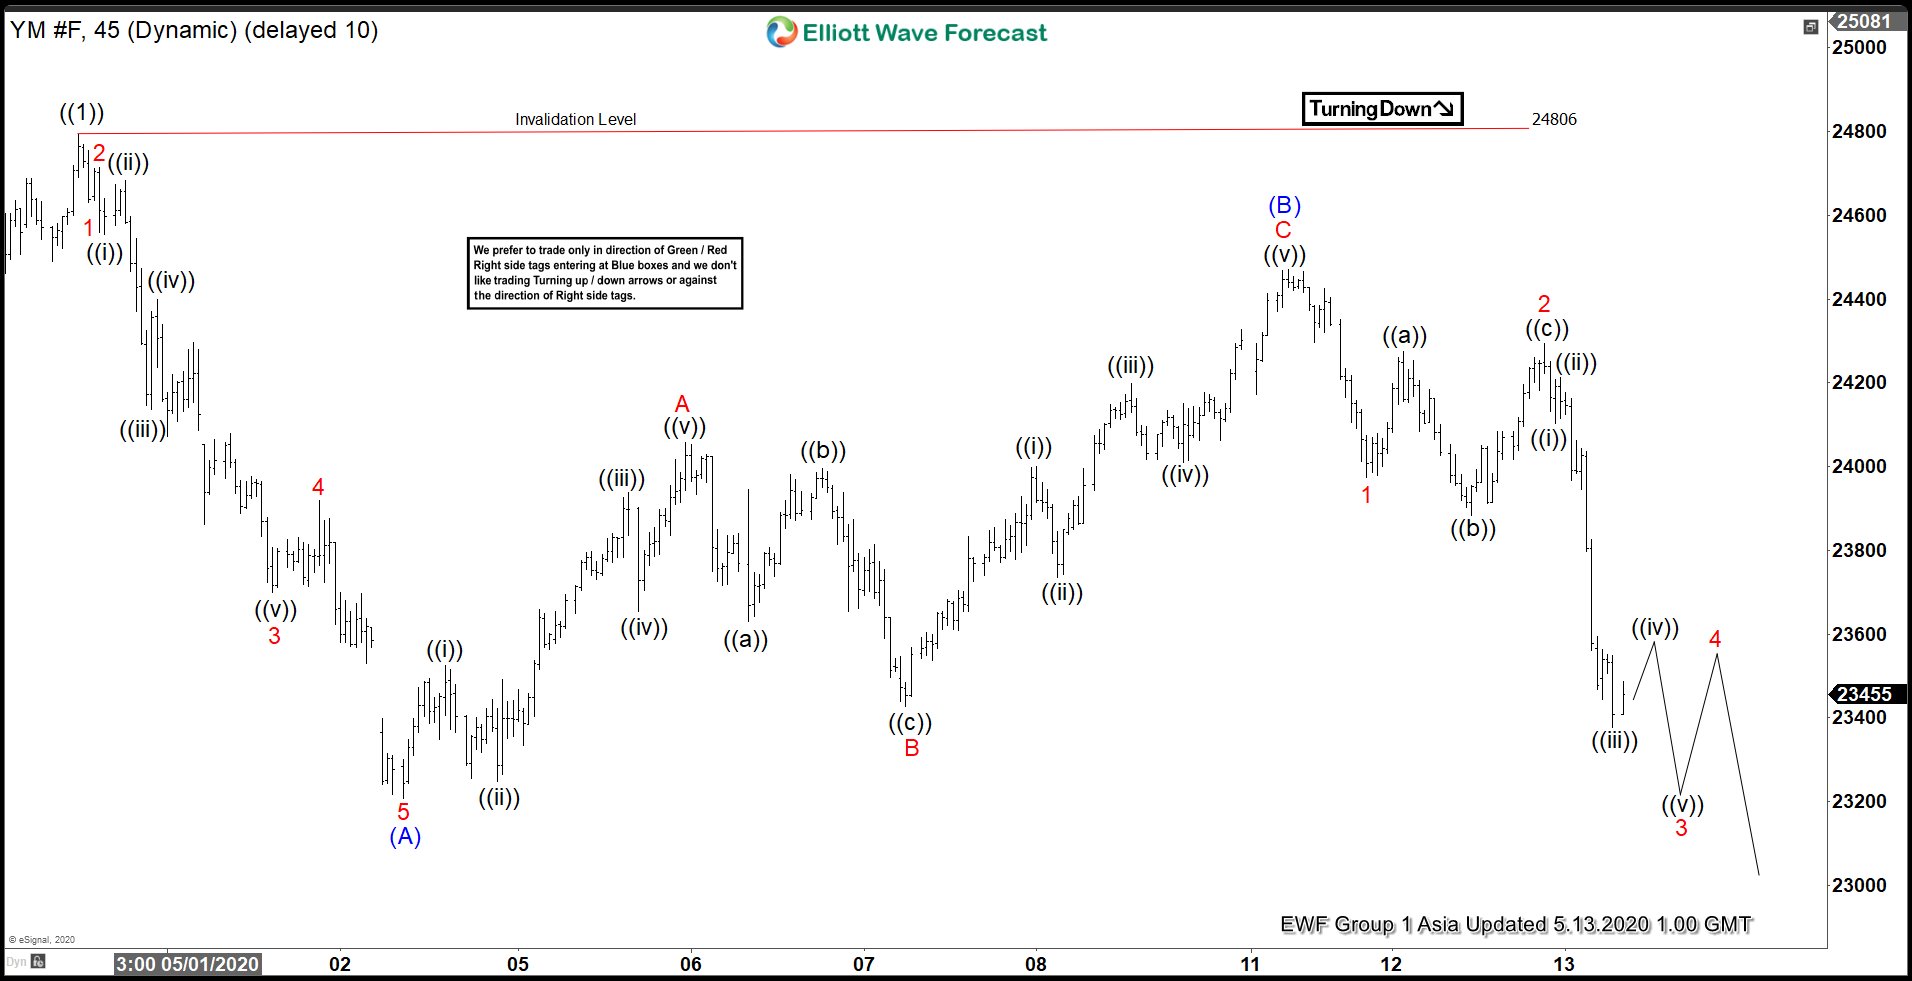
INDU 1 Hour Elliott Wave Analysis 5.13.2020
We are getting pull back against the March 18058 low. Cycle from the 24806 peak is unfolding as (a)(b)© Elliott Wave Zig Zag pattern. First leg (A) blue unfolded as 5 waves down from the peak. Then we got 3 wave bounces in wave (B) , which has made deep retracement against the 24806 peak . And finally, we’re doing last leg down © blue. Pull back looks incomplete at the moment. We expect more weakness, to complete 5 waves in © leg. We don’t recommend selling the Index.
You can learn more about Zig Zag Elliott Wave Patterns at our Free Elliott Wave Educational Web Page .
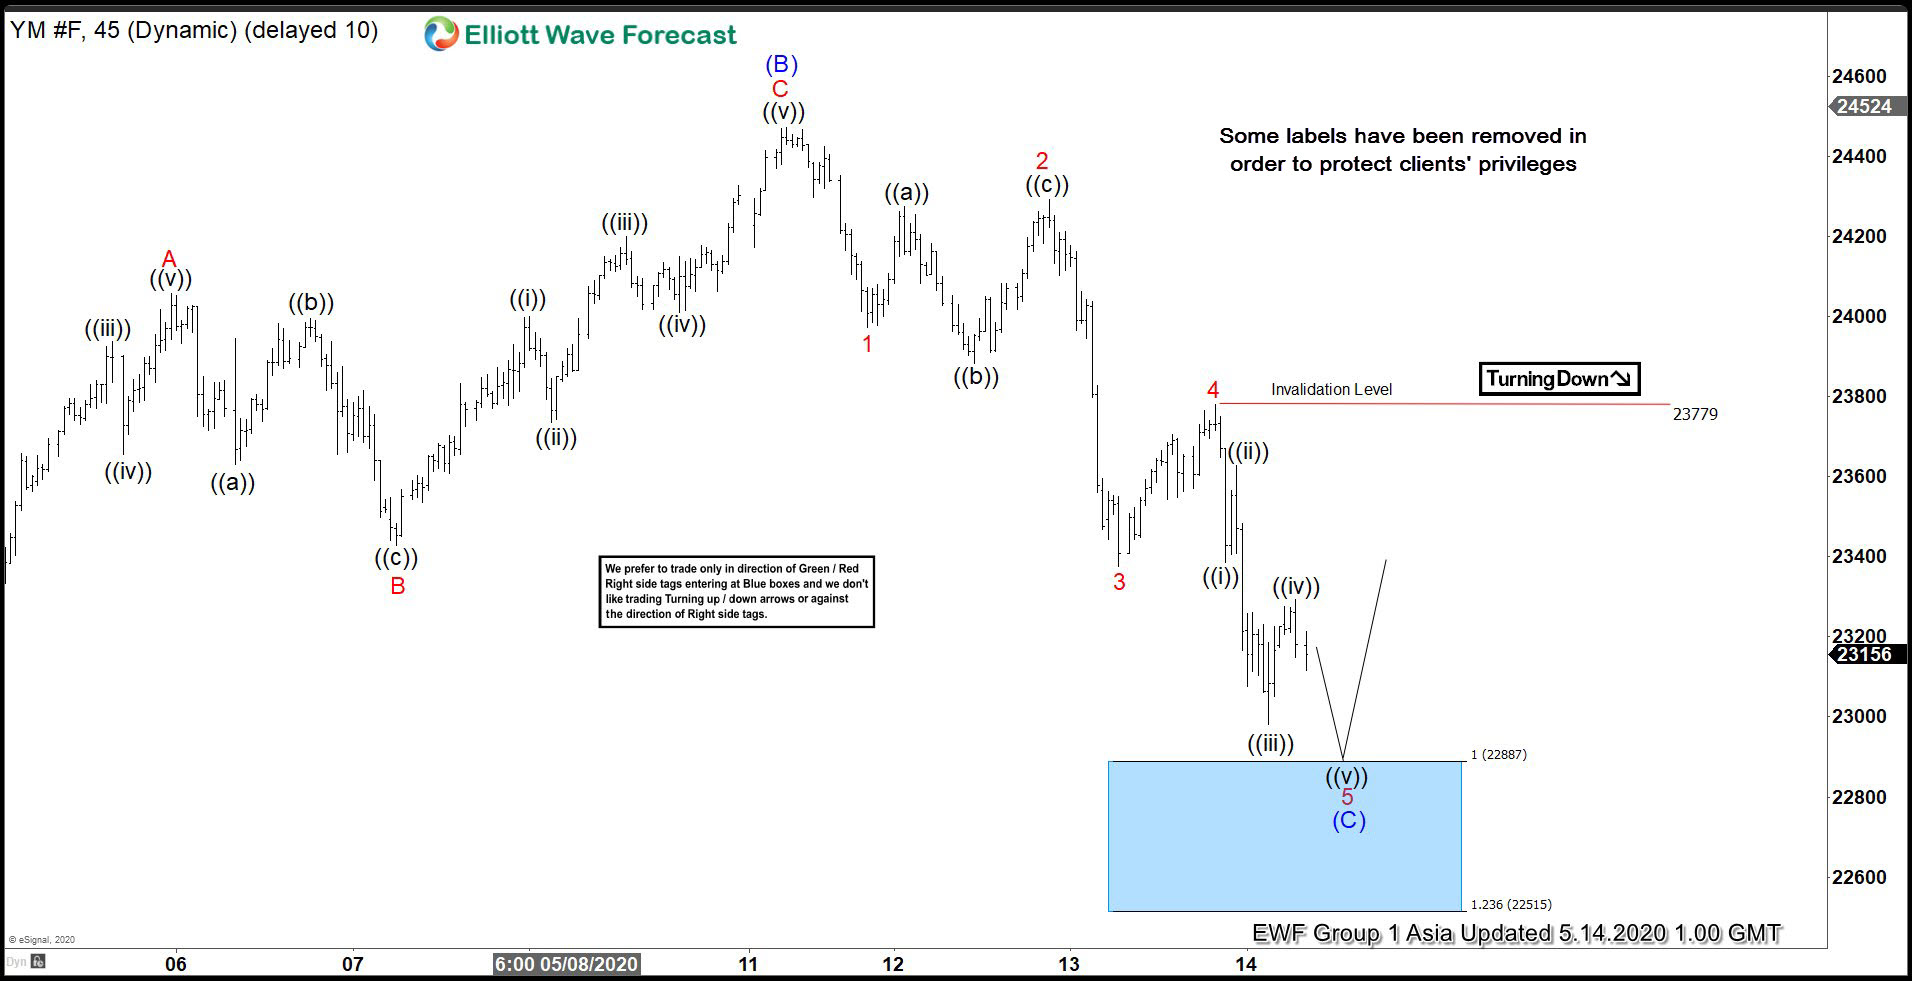
INDU 1 Hour Elliott Wave Analysis 5.14.2020
Wave © is still in progress. The price hasn’t reached equal legs (A)-(B). We expect another leg down toward 22887-22515 area ( blue box area). At the marked Blue Box area area we expect buyers to appear for further rally toward new highs ideally . As our members know Blue Boxes are no enemy areas , giving us 85% chance to get a bounce.
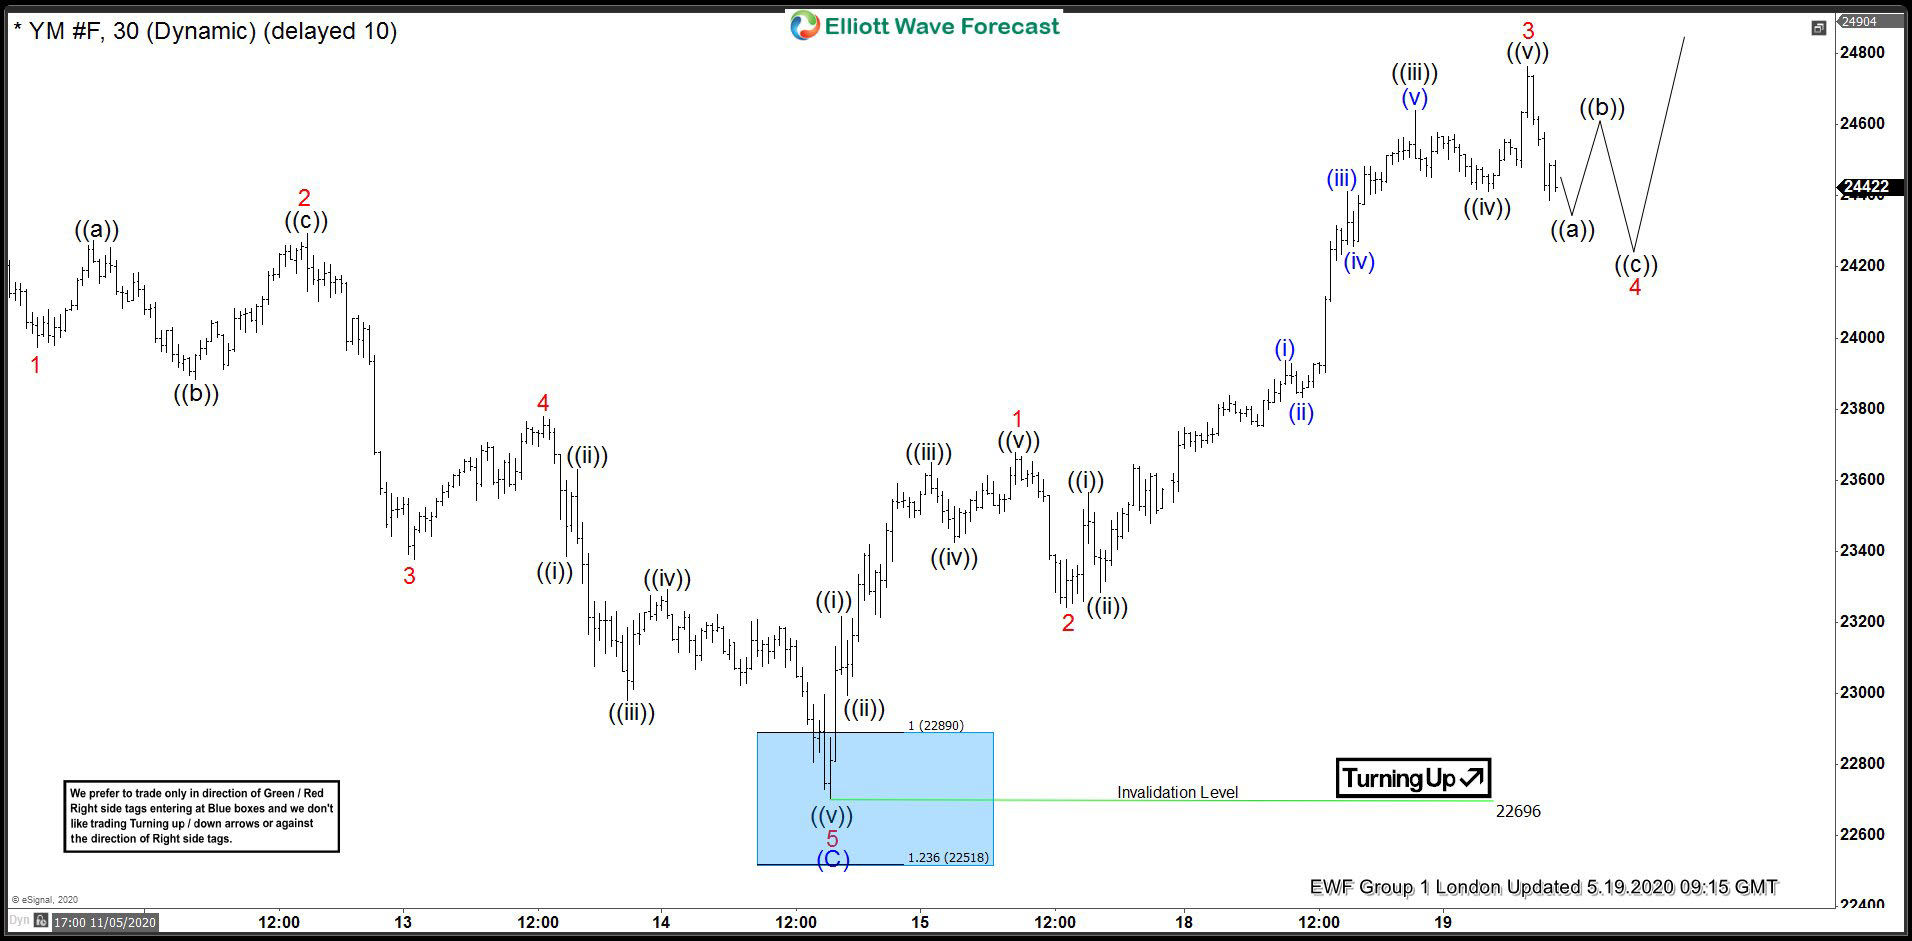
INDU 1 Hour Elliott Wave Analysis 5.19.2020
INDU found buyers right at the blue box area :22887-22515 area. Pull back wave ((2)) ended as Elliott Wave Zig Zag at the 22696 low. We got nice rally from there, however need to see break above 04/30 peak to which would make bullish higher high sequences in the March 23th cycle. That would be confirmation next leg up is in progress. Short term cycle from the 22696 low is unfolding as 5 waves rally, when we can still be in 4 red pull back.
Keep in mind market is dynamic and presented view could have changed in the mean time. You can check most recent charts in the membership area of the site. Best instruments to trade are those having incomplete bullish or bearish swings sequences.We put them in Sequence Report and best among them are shown in the Live Trading Room
Elliott Wave Forecast