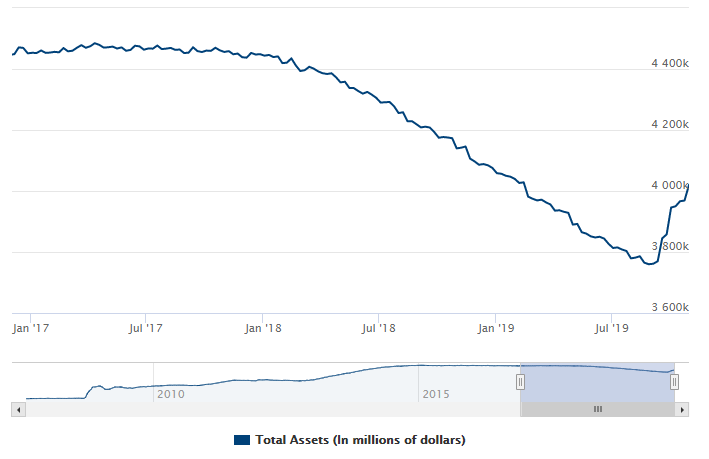
The Fed’s monetary stance has turned 180 degree this year. Recall last year the Fed talked about shrinking the balance sheet on auto pilot and raising interest rate. The QT (Quantitative Tightening) of $50 billion a month, according to former Fed Chair Janet Yellen, should be boring like watching paint dry. By July this year, the $50 billion monthly rundown has ended. Instead, the Fed embarks in another balance sheet inflation to the tune of 60 billion a month. In mid-September, short term funding in repo market spiked to 10% from 2% overnight. This suggests stress in the financial system as some banks and financial institution can’t find necessary cash in the market. The Fed quickly points out this balance sheet expansion is different than asset purchase from years ago. Below is the chart of the Fed’s balance sheet. It has dropped steadily from 2017 and reverses higher this year.
Late last year the Fed said they intend to raise interest rate three times. This year, the Fed has instead cut interest rates for the third time. The mounting criticism by President Trump and slowing US economy due to the trade war with China forces Fed’s hands. If the Fed cuts interest rates one more times, it would have completely undo the four interest rate hikes in 2018. These actions to boost balance sheet and cut interest rate amount to complete reversal of the Fed policy from a year ago.
The US Dollar has steadily gained strength in the past year due partly to the expectation that the yield spread between US Dollar and other currencies will widen. The Fed is also the first central bank who is able to unwind the balance sheet after the unprecedented global monetary easing in response to the 2008 financial crisis. But as those factors are now no longer present to support U.S Dollar, is it time to start turning?
US Dollar Broke Bullish Channel from 2018 Low
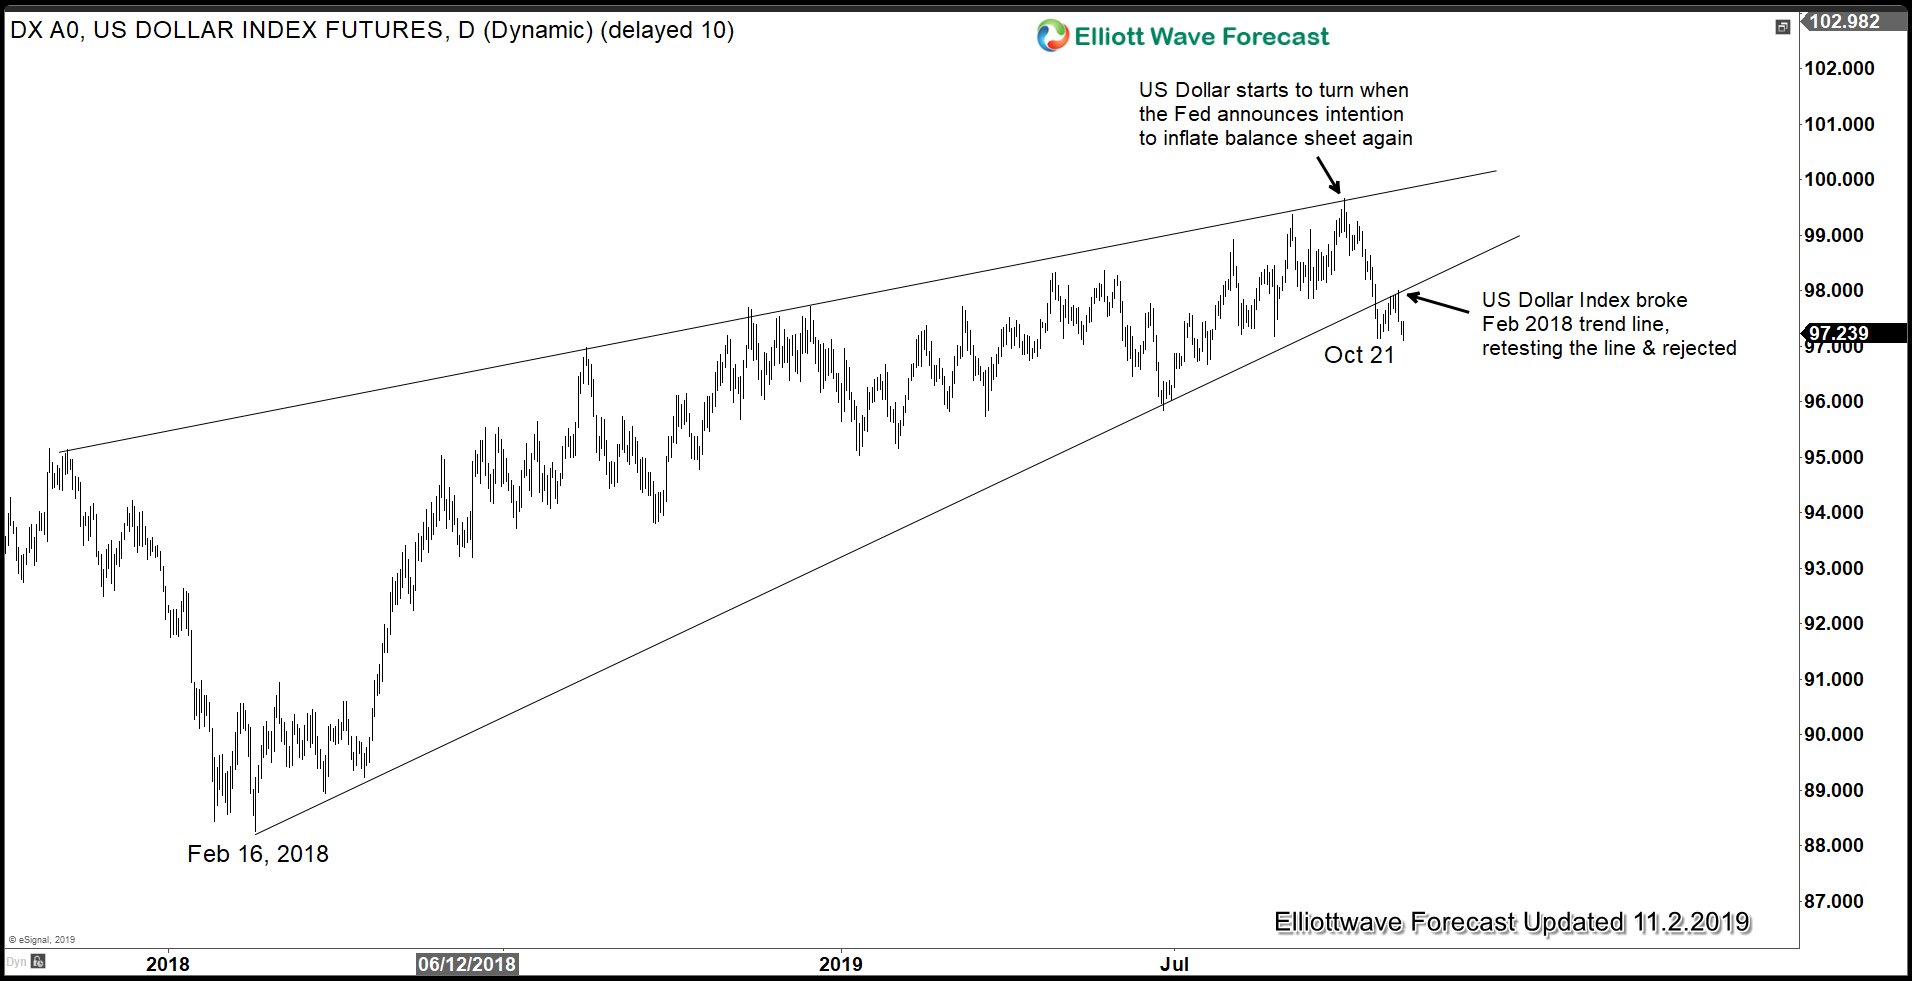
The US Dollar starts to reverse at October 1, around the same time when the Fed says they intend to expand balance sheet again. We can see from the chart above that the Dollar Index has broken below the February 16, 2018 rising trend line in what looks like a wedge pattern. In addition, on Friday’s closing last week, it broke below October 21 low (97.14), creating a short term bearish sequence from October 1 high. It’s possible that the Dollar Index has ended the rally from Feb 16, 2018 low. If this is the case, then we should see a larger pullback to correct this rally in 3, 7, or 11 swing.
Dollar Index Daily Elliott Wave Chart
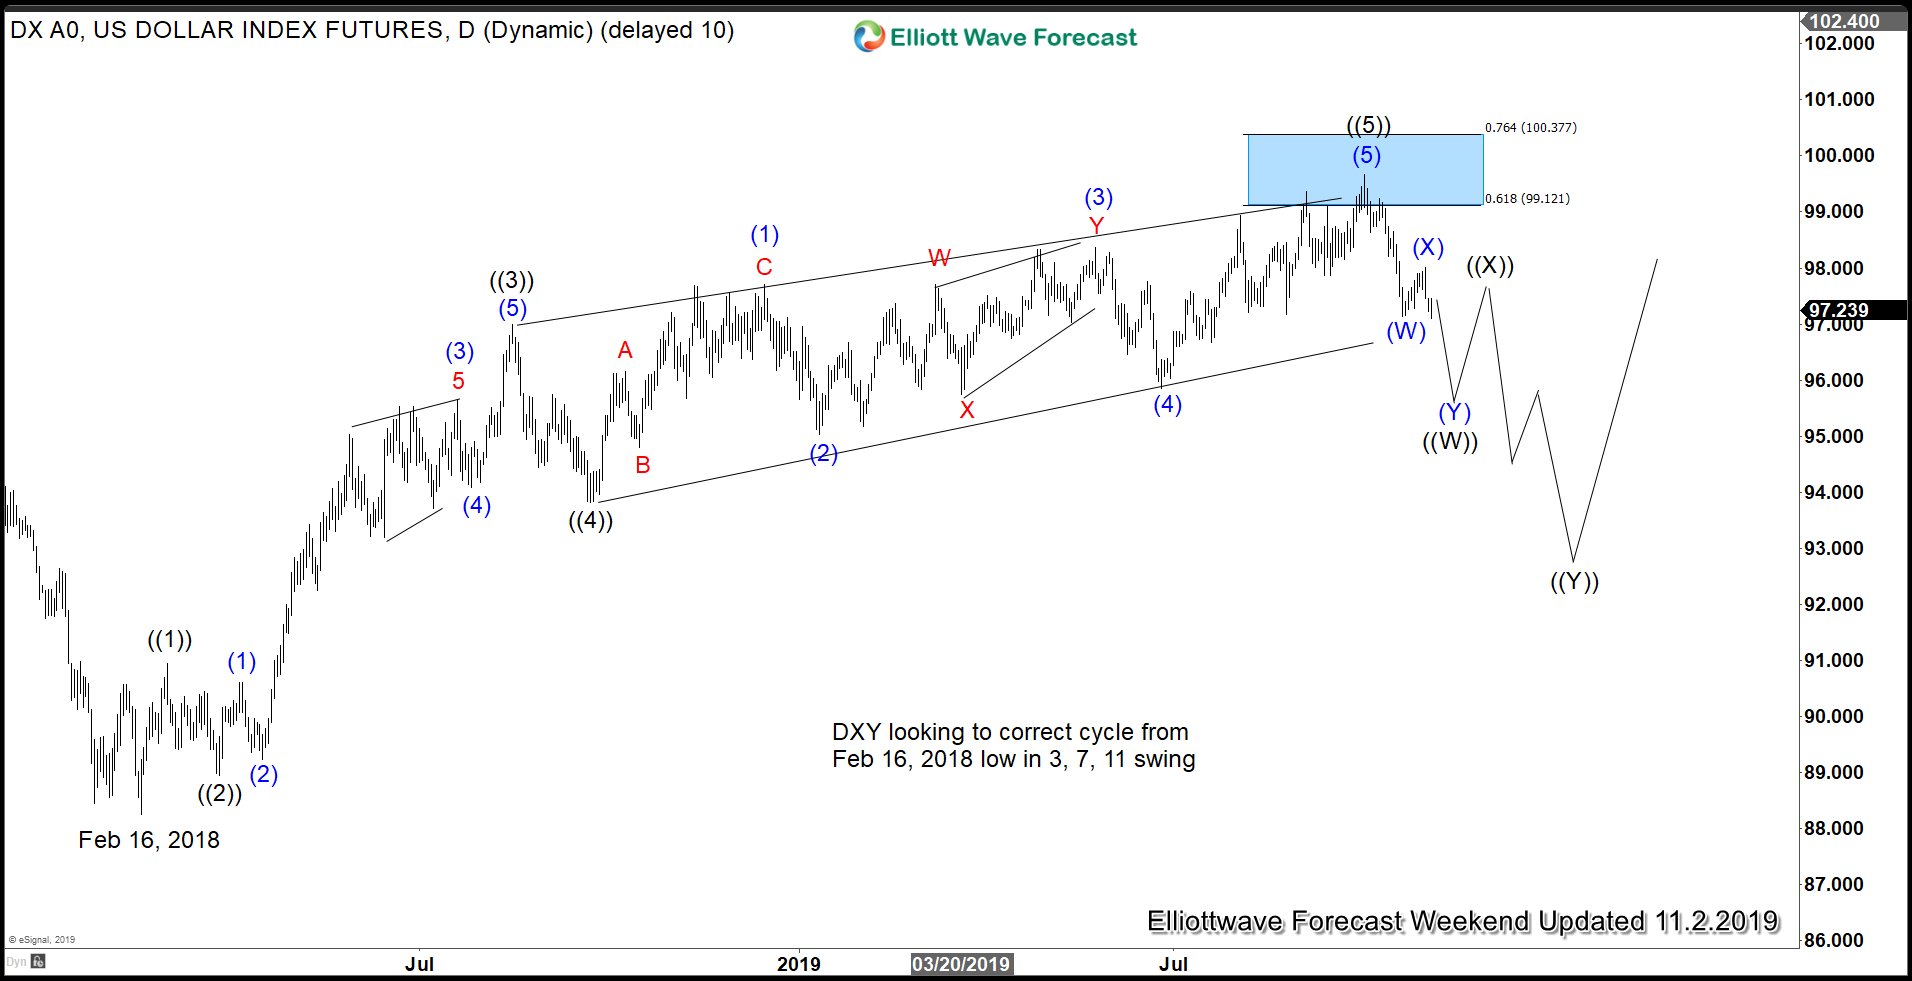
Daily chart above suggests cycle from Feb 2018 low has ended as a 5 waves impulse with wave ((5)) internal subdivision as an ending diagonal. Dollar Index should then weaken in next few weeks / months in larger degree in 3, 7, or 11 swing to correct the rally.