iTrade Weekly Report

I entered two trades last week. The first was a buy in US Crude Oil, the second a buy in US Natural Gas. Both are looking good to date, and I expect these positive results to continue.

Results to date are tabled below:

Both technical and fundamental factors remain positive for oil and gas, so I will be hanging on to these positions for at least a little while yet. I give a brief breakdown below.

Be wary of those NGAS swap fees! Youch!

1 Like

Oh yeah! They do hurt when prices are drifting sideways.

I closed my buy position in US Natural Gas this week for a $255.87 net profit. I think this uptrend will continue over time, but these daily swaps really hurt when prices are drifting sideways. I am out, and will stay out for the time being.

Transaction history from last week:

US Crude Oil

My US Crude Oil buy remains open. Oil prices are now approaching resistance, established at $76.780 back in October, 2018, and offering a potential profit target or scaling-out opportunity. I have $359.10 floating profit.

The fundamentals are strengthening their support for higher prices. Oil stocks continue to trend downwards, now for six straight weeks in a row, suggesting strong demand. The Baker Hughes rig count keeps growing.

My conclusion - hold buy position for now. Look at these fundamentals.

Stocks of crude oil in the United States fell by 8.153 million barrels in the week ended June 25th, 2021, following 7.199 million drop in the previous week, and compared with market expectations of a 4.460 million decline, data from the American Petroleum Institute showed. source: American Petroleum Institute (API)

US crude oil inventories dropped by 6.718 million barrels in the June 25th week, a sixth consecutive period of decline and compared with market consensus of a 4.686 million fall, data from the EIA Petroleum Status Report showed. Meantime, gasoline inventories were up by 1.522 million barrels, defying forecasts of a 0.886 million decrease. source: U.S. Energy Information Administration

Crude Oil Rigs in the United States increased to 376 in July 2 from 372 in the previous week. source: Baker Hughes Company

I have deployed a strategic stop loss on my crude oil buy position. The stop is placed at 74.446, just beneath nearest support level. This trade is now risk-free, and it guarantees a $229 profit regardless of what happens next.

So I take a $229 profit.

Prices tumble, but have since bounced back, and we are still no wiser on the OPEC+ oil output agreement.

I am out for the moment, and waiting for another buy opportunity.

OPEC+ is in disagreement over production quotas. The U.A.E wants more, so no agreement to date. This should be interesting.

Even if agreement is reached, and an extra 500,000 barrels a day begin to flow, oil stocks are at historic lows and suppliers are struggling to keep pace, in the short-medium term at least. There is a global oil stock deficit.

Will update again soon.

1 Like

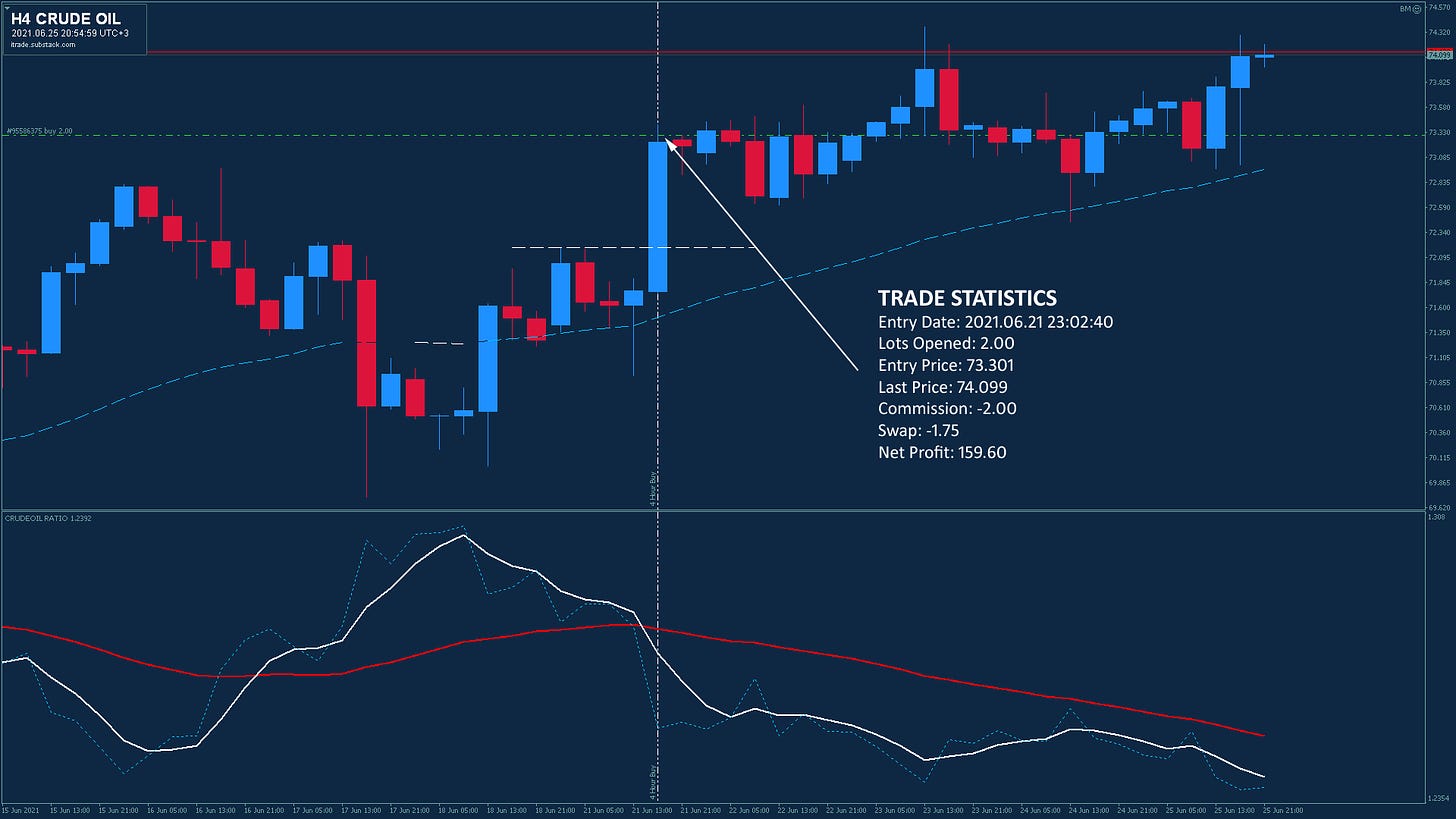
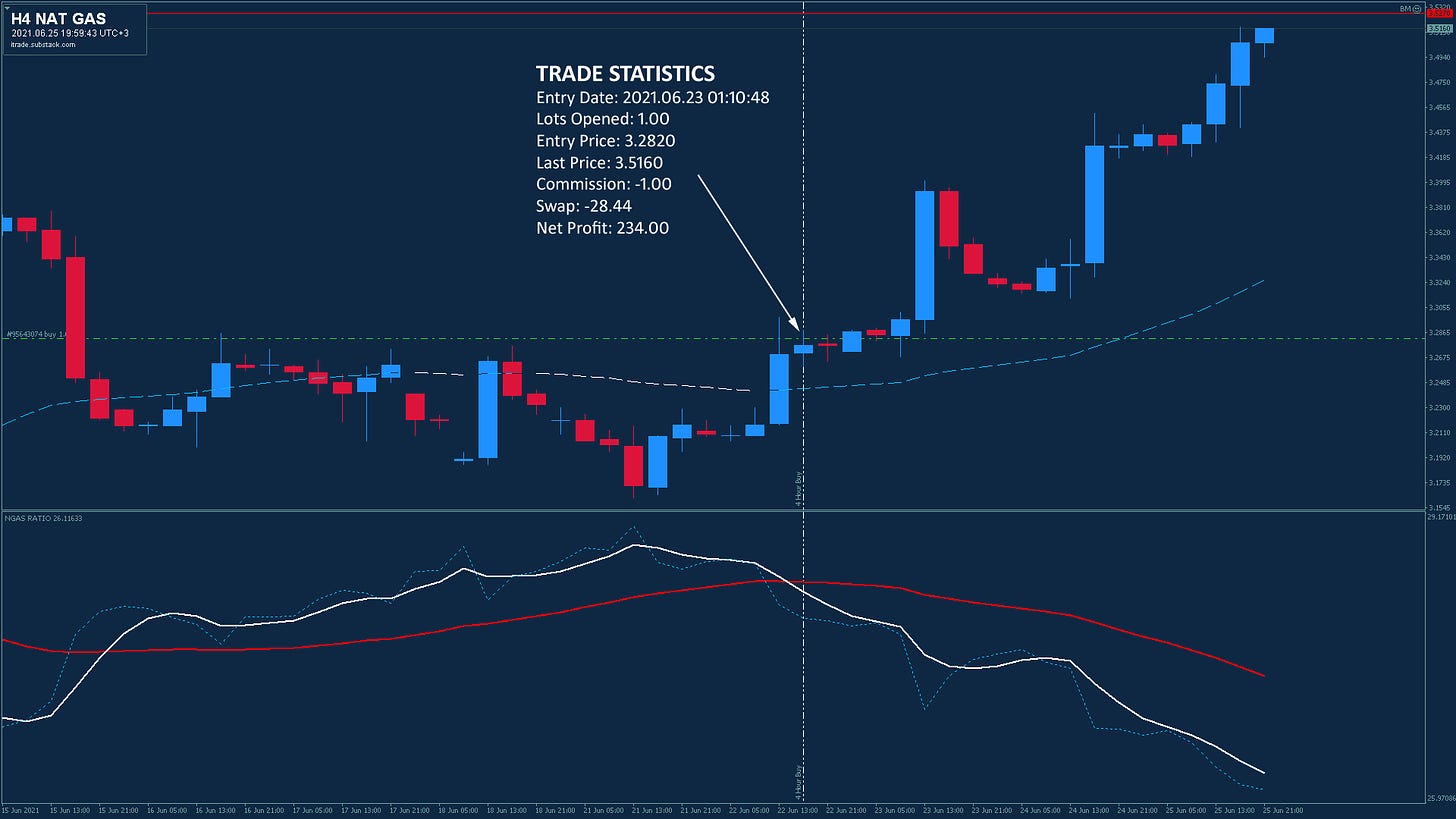
I closed my buy position in US Crude Oil this week for a $223.25 net profit.

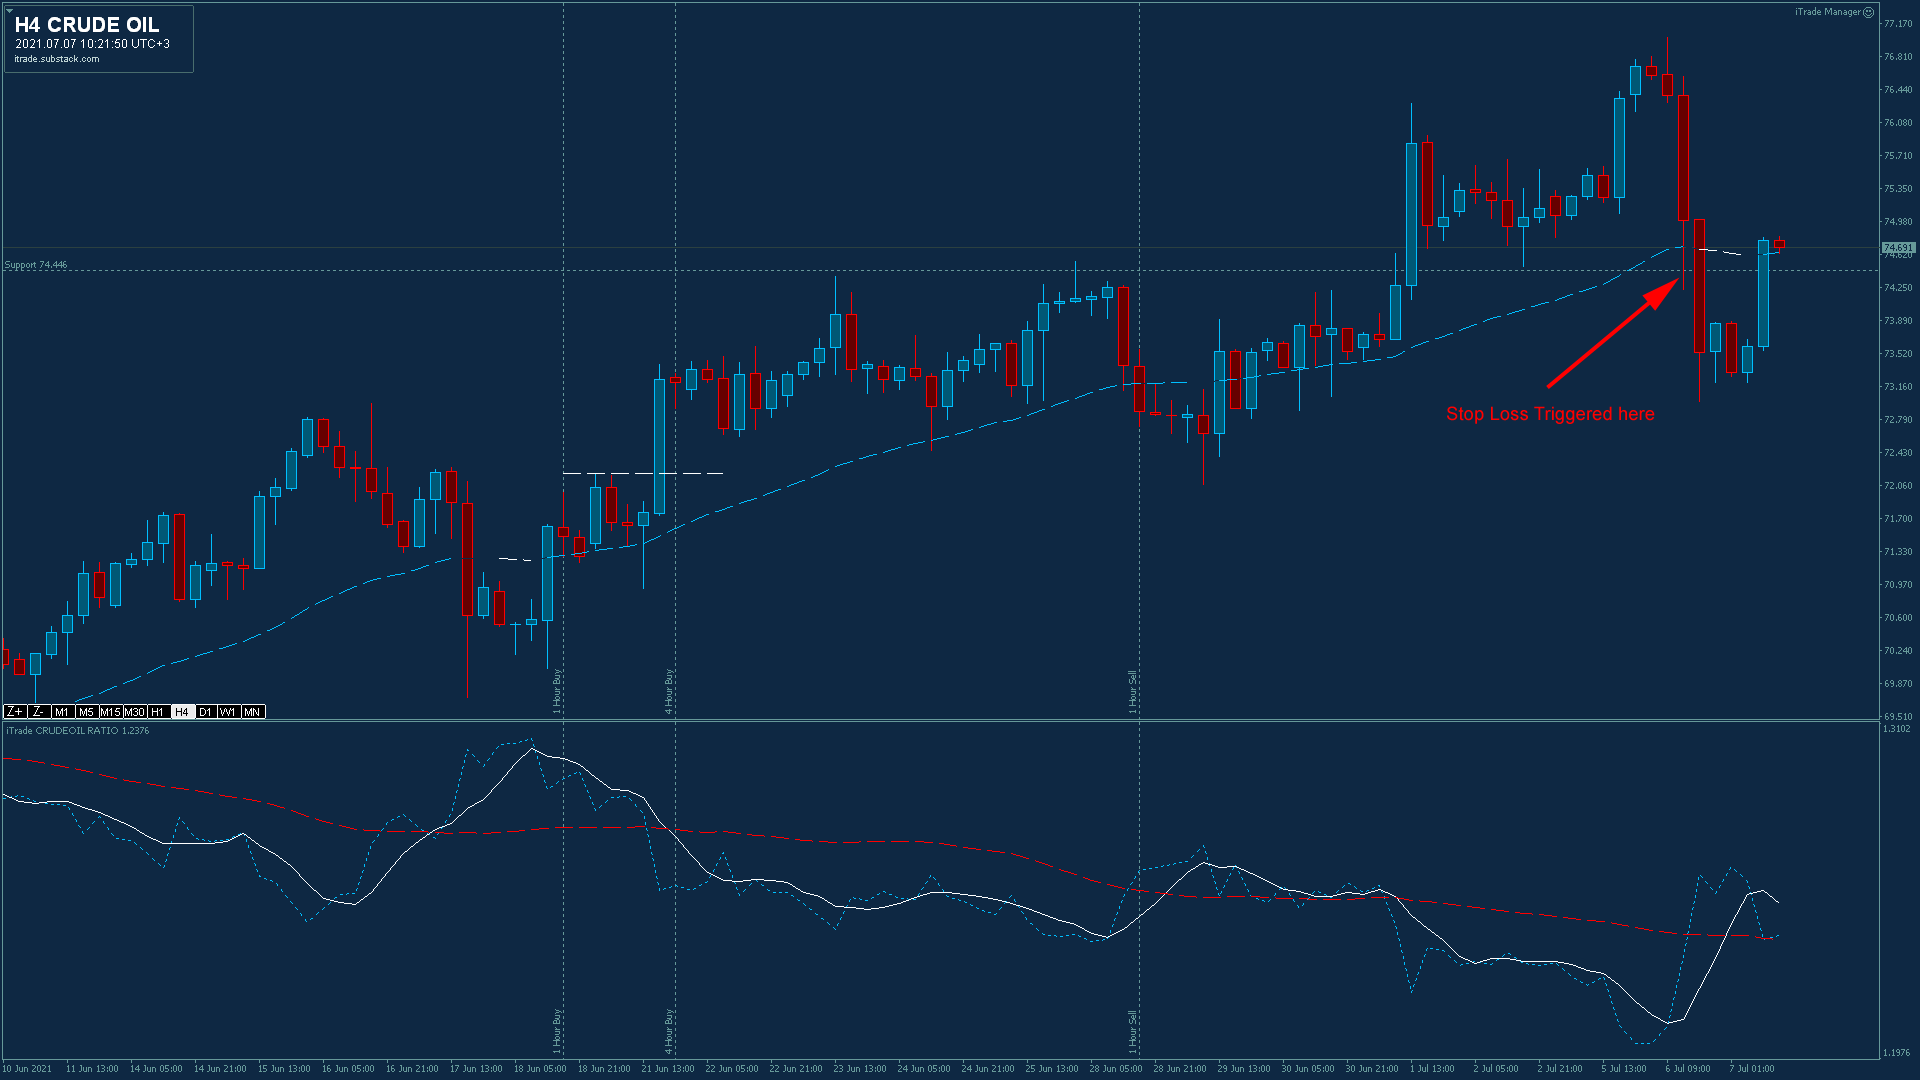
My strategic stop loss was triggered at 74.446, as prices tumbled after OPEC+ talks were abandoned.

As it sits, OPEC+ members want to increase oil production, the disagreement is over the increase amount. The UAE, for instance, agrees with increasing production, but says it “wants a level playing field”, which translated means, proportionally higher oil production over other OPEC+ participants.

Meanwhile, the fundamentals “strongly” support higher crude oil prices if oil production is not increased.

OPEC allies are at odds over a proposed deal that would have brought more oil to the market.

Strong positive fundamentals are driving crude oil prices higher. Crude oil inventories remain stubbornly low, and gasoline stocks have taken a tumble. Supply continues its tightening.

But then stories like this.

“Prices were weighed down early in the week by the collapse of output talks between the Organization of the Petroleum Exporting Countries (OPEC) and allies including Russia, together known as OPEC+. “

So why did crude oil prices take a tumble?

Well, the reasoning is that if one member goes rogue, and sets its own production output, others may follow suit. A rush of new supply into the arena putting downward pressure on prices.

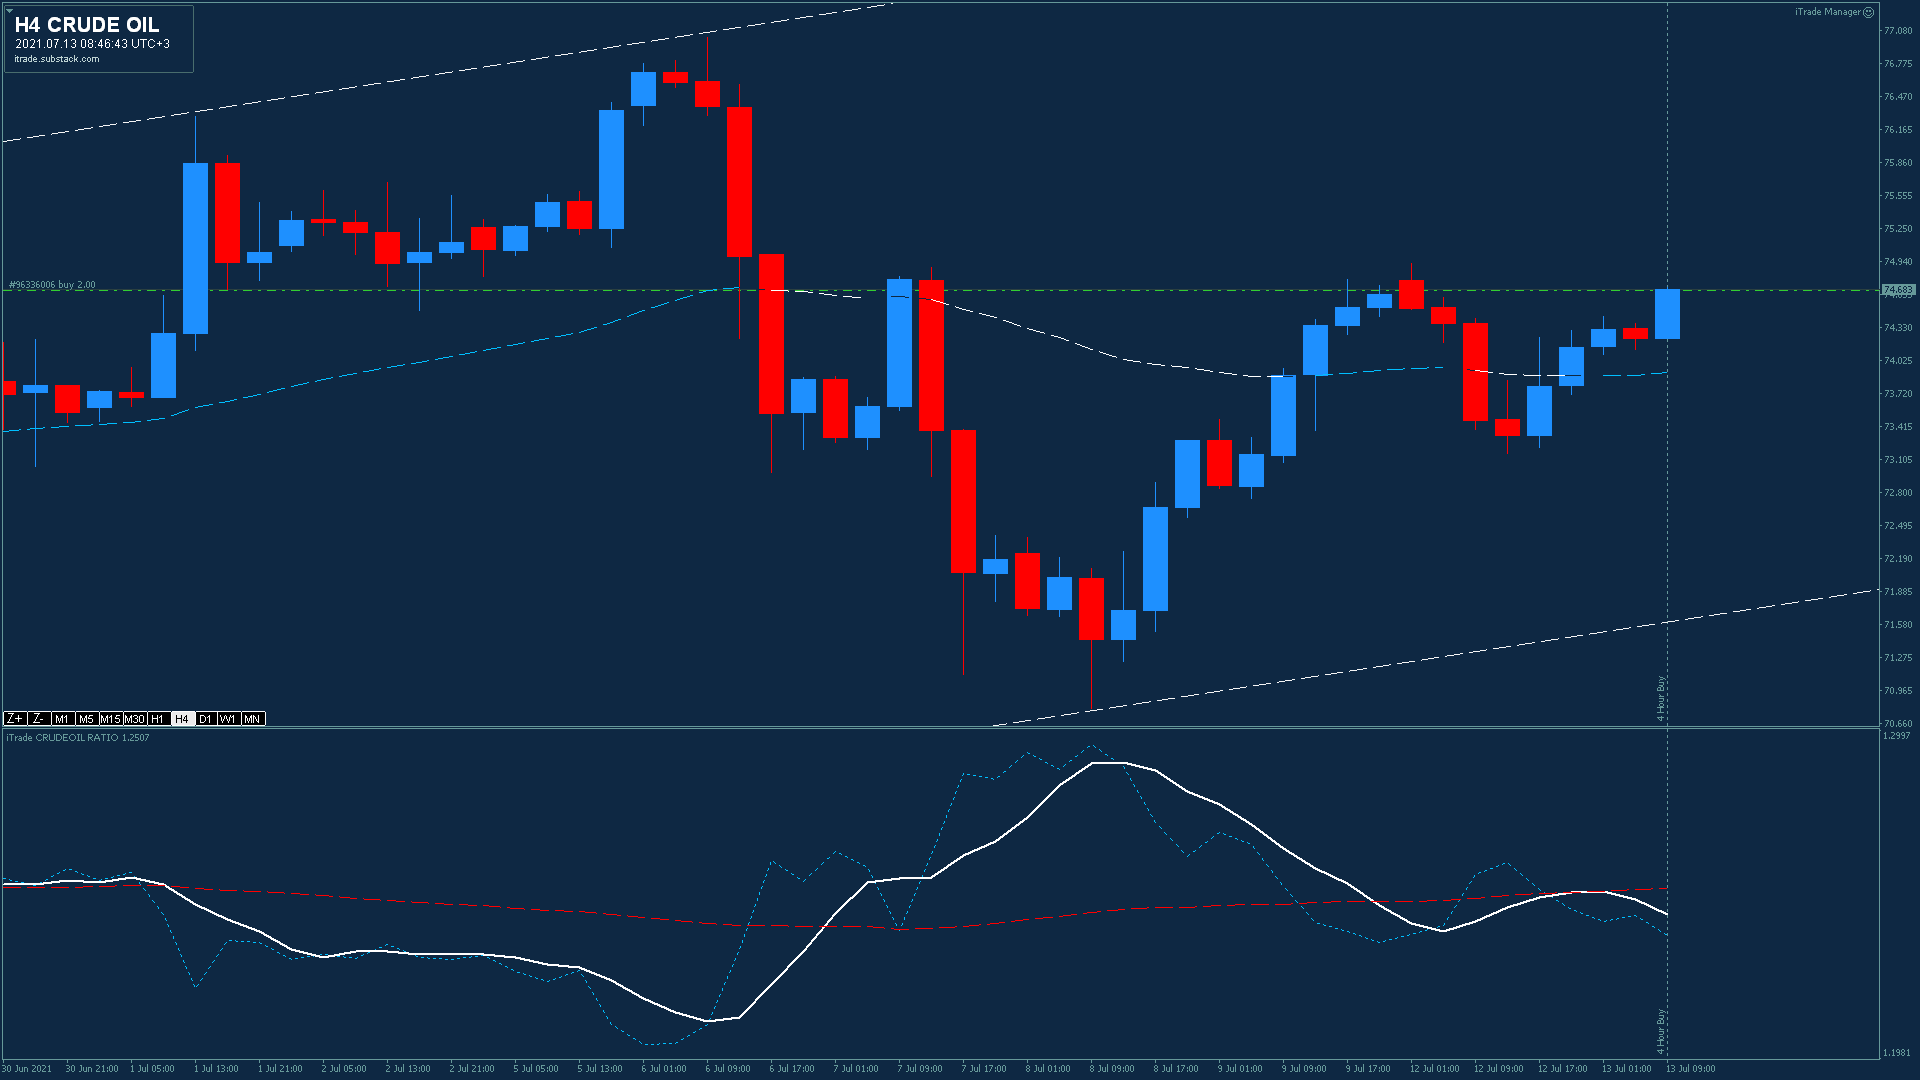
But look at the 4-hour chart. Prices have already recovered quite a bit. The fundamentals remain true, and prices should be rising. That is exactly what prices are doing right now.

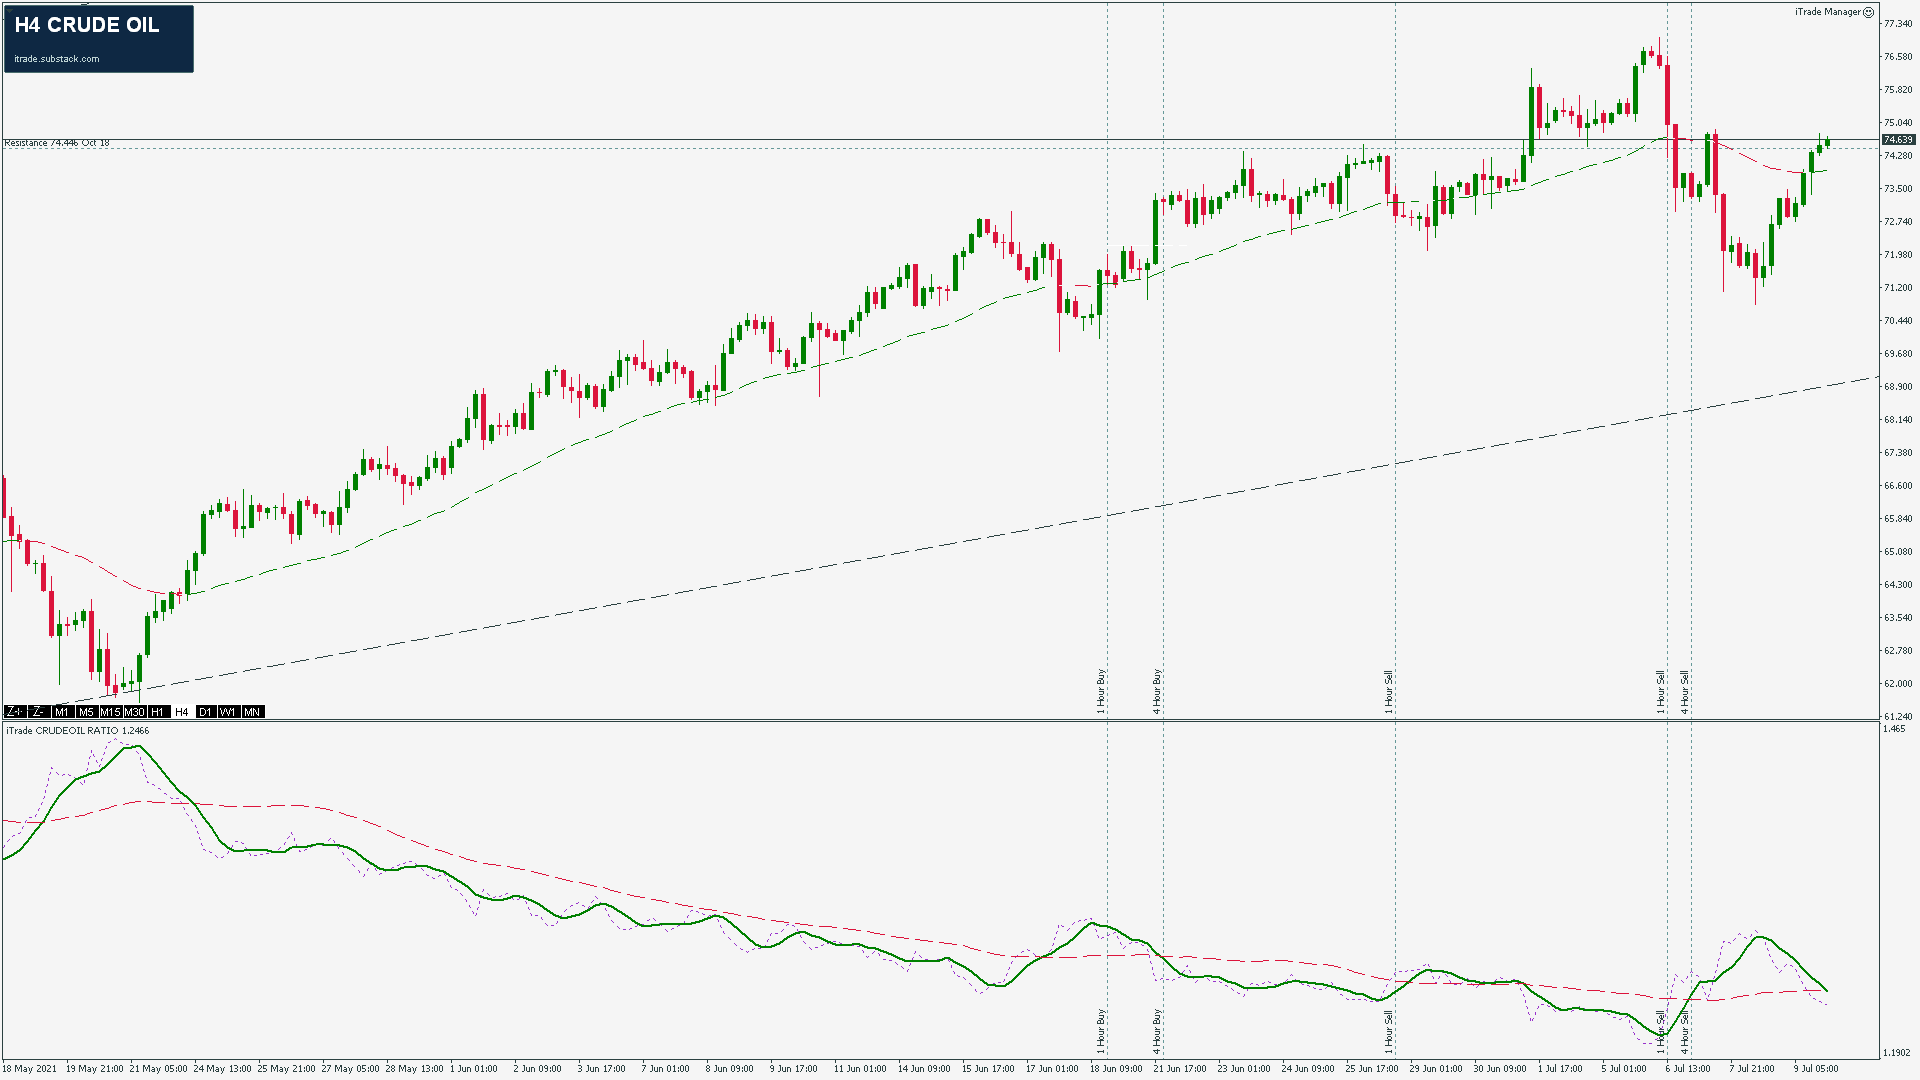
All the activity in the 4-hour chart above, is contained within the last 9 price bars in the daily chart below. Barely a blip on the radar

The obvious uptrend is exactly what you would expect to see given that crude oil inventories are still negative, imports are flat, and the U.S. crude oil rig count, despite 10 straight weeks of increases, is unable to satisfy demand.

The OPEC+ meeting has caused some unexpected volatility, but nothing more. While the fundamentals remain in their current status, with demand strongly out-performing supply, prices will continue to rise.

Just have to wait for the next buy opportunity.

While you wait, have a deep and meaningful meeting with the fundamentals below.

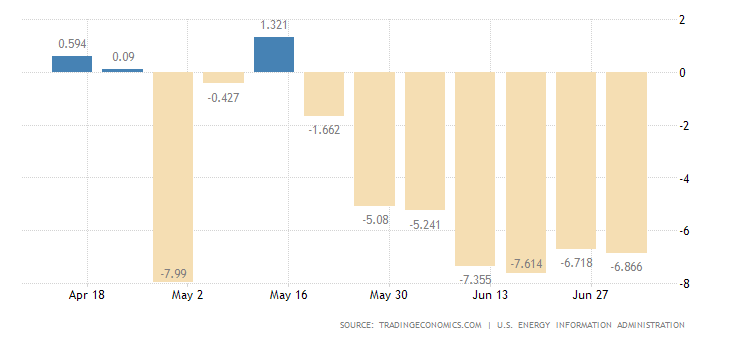
API Crude Oil Stocks Report

Stocks of crude oil in the United States fell by 7.983 million barrels in the week ended July 2nd, 2021, following an 8.153 million drop in the previous week and marking the seventh straight weekly decline, data from the American Petroleum Institute showed. It compares with market expectations of a 3.925 million fall. source: American Petroleum Institute (API)

EIA Crude Oil Stocks Report

U.S. crude and gasoline stocks fell and gasoline demand reached its highest since 2019, the U.S. Energy Information Administration said on Thursday, signalling increasing strength in the economy.

But gains in oil prices were capped by worries that members of the OPEC+ group could be tempted to abandon output limits that they have followed during the COVID-19 pandemic, with talks breaking down because of an impasse between major producers Saudi Arabia and the United Arab Emirates.

Crude stockpiles in the US dropped by 6.866 million barrels in the July 2nd week, to the lowest level since February of 2020, data from the EIA Petroleum Status Report showed. It is the 7th consecutive weekly decline, compared with market consensus of a 4.033 million fall. Meantime, gasoline inventories were down by 6.076 million barrels, much more than forecasts of a 2.176 million decrease, and the biggest decline in 4 months. source: U.S. Energy Information Administration

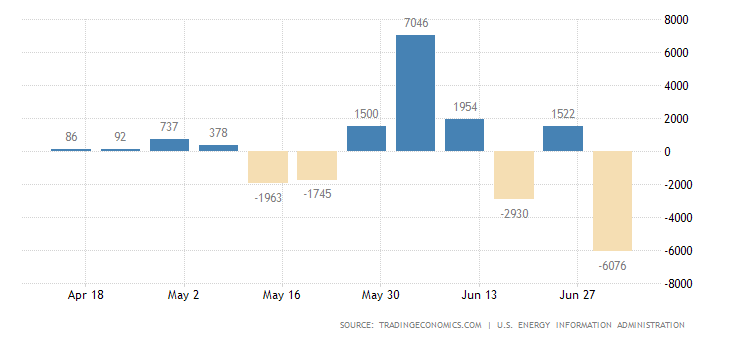
Gasoline Stocks Change

Stocks of gasoline in the United States decreased by 6076 thousand barrels in the week ended July 2 of 2021, the biggest drop in 4 months. source: U.S. Energy Information Administration

Crude Oil Imports

Crude Oil Imports in the United States increased by 558 Thousand Barrels in the week ended July 2nd 2021. source: U.S. Energy Information Administration

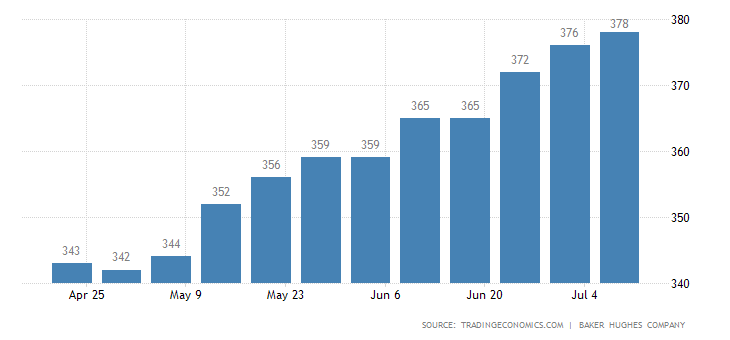
Baker Hughes Oil Rig Count

The rig count has risen for 10 straight weeks in a row, but inventories keep falling.

Crude Oil Rigs in the United States increased to 378 in July 9 from 376 in the previous week. source: Baker Hughes Company

I entered a buy trade on US Crude Oil at 74.673 late yesterday, based on the “known” fundamentals and current price action. That is, despite the uncertainty caused by OPEC+ production agreements, the fundamentals show that crude oil supply remains incredibly tight, and will continue for a while yet.

The reported compromise between key OPEC members Saudi Arabia and the United Arab Emirates (UAE), will see the UAE baseline production level lifted from 3.17 million barrels per day to 3.65 million barrels per day after the current pact expires in April 2022 . That is 9 months away.

Meanwhile, crude oil stocks remain negative, but gasoline stocks rose to 1.039 million barrels in the July 9th week, following a 6.076 million decline in the previous week. Does this mean demand is weakening? Hard to tell from one week of gasoline stocks data.

But, look at the U.S. crude oil and gasoline stocks 5-year range charts below. Both are trending down and appear to have some way to go yet. Assuming global and U.S. economic recovery continues, crude oil prices are likely to move higher at least for a while yet.

Continued economic recovery is now the key to future pricing.

US Crude Oil Stocks
US Gasoline Stocks.gif

OPEC’s June production data suggests that the group sees a tight market that is able to absorb additional OPEC supply. The organization sees demand for OPEC crude in 2021 unchanged from the previous report at 27.7 million bpd, which would be 5 million bpd higher than in 2020. Next year, demand for OPEC crude is forecast to rise even further—by 1.1 million bpd from 2021—to an average of 28.7 million bpd.

The daily U.S. crude oil price chart below gives some perspective on recent price movements. The July 21 price pull-back is about the same as May 21, and less significant than March 21, and price action remains contained within the price channel.

I am holding long positions for the time being, and monitoring events and activities.

1 Like

@GazzaFx Your conclusion seems to be the correct one.

Oil Prices Crash After OPEC+ Reaches Deal To Ease Cuts

Oil prices dropped by 5 percent early on Monday, with WTI Crude slipping to $67 per barrel, after OPEC+ decided on Sunday it would start returning 400,000 barrels per day (bpd) to the market every month beginning in August until it unwinds all the 5.8 million bpd cuts.

The prospect of monthly increments in oil supply from the OPEC+ alliance comes just as COVID infections are rising in many countries because of the faster-spreading Delta variant. Concerns over potential hiccups in global oil demand recovery amid rising supply from OPEC and its Russia-led non-OPEC partners dragged oil prices down on Monday.

As of 8:22 a.m. EDT, WTI Crude prices were trading down by 3.9 percent at $69.01 and Brent Crude was down 3.52 percent at $71.00.

The fact that OPEC+ reached a deal on production and baseline production levels removed a major uncertainty from the market, some part of which was fearing a breakup in the alliance.

The deal is constructive for the market, Helima Croft, head of global commodity strategy at RBC Capital Markets, told CNBC, noting that “This agreement should give market participants comfort that the group is not headed for a messy breakup and will not be opening up the production floodgates anytime soon.”

ING, for example, kept its oil price forecast of $75 per barrel for Brent Crude over the third quarter this year because the supply additions from OPEC+ are in line with the bank’s earlier projections.

“Healthy demand growth combined with moderate supply increases from OPEC+ will likely remain supportive for the oil market in short term at least,” ING strategists Warren Patterson and Wenyu Yao said early on Monday.

Goldman Sachs continues to be bullish on oil and even sees the OPEC+ deal as having a $2 per barrel upside to its $80 a barrel Brent outlook for this summer.

By Tsvetana Paraskova for Oilprice.com