Has there been testing on which time frames produce the most positively consistent results?
@macgyver i watch them all  seriously I watch around 20 pairs or so. a chart is a chart is a chart.
What I do is this;
Every night around 7ish i look at my charts the daily closes at 8 pm est. so I start to look for what might close as a set up.
so basically I am looking for my price action first nothing else
I only start my analysis once there is pa or unless I am “feeling it” like the gbpusd there I am looking for a reason to short if the market shows me the right signs.
so after i spot pa wether it is a pb an ib an ob dblhc dbhlc then…
only after i spot a setup forming will I look closer now i am looking first for ppz or round numbers or other bar highs or bar lows or whatever traffic there is and at what level do I expect price to hang up and stall at. if there is no room I pass if there is something "playable i continue to …
next move look for confluence here i am looking at fibs, 150 ema 365 ema and divergence.
At this point if i like the setup then (if the daily candle has closed) I will set my market stop order to get me in at the break of the pa. i usually set my stop loss at the bar high/low of the pa and i set my take profit limit order at the first ppz or round number.
If I had more time to manage the trade then I would move my stop to break even at that first ppz and let it go to see if I catch a big move.
this is my ritual and as you guys know I am relativly new to this material so Im sure I will change it up some over time.
@propaganda I like the daily and the originator of this methodology stresses beyond stresses that please demo first on daily for at least 3 months. If you cannot show profit on the daily and or weekly on demo you will not be profitable on h4 and certainly not with real money.
Do not risk your hard earned money until you are confident that you understand this material. Don’t be in a rush. the supposed “gurus” out there want you to believe in overnight riches but this is a lie. that is why 95% fail. they have stars in there eyes of earning tons and tons every week and becoming rich overnight but htis is a marathon if you treat it like a sprint you will be on the ground gasping for air and there will still be miles and miles.
just start demo on dailys and weeklys for a while till you get good at it.
Yes that makes a lot of sense and I was thinking of working in the same manner, until I found a post over in James16 thread: Forex Factory - View Single Post - james16 Chart Thread that made a lot of sense to me.
Going that route however means more work as you have to place ALL the PPZ ahead of time, instead of just examining the charts where bar formations turn up.
But I think I’ll try to take that burden every Sunday, it’s worth it to know I’m not curve-fitting myself to the poor house 
I guess time will tell how many pairs I can manage, will start with about 20. Well exactly 20 actually.
hey mac thanks for the post i guess i may need to reexamine my own process coz what he says makes total sense.
Well said Jhonny
For the process of setting up my charts…personally the first thing I do is zooming out much as I can on daily, and spotting the major PPZs. Than I zoom in a bit and spot the small PPZs around the current price.
I WAIT FOR THE PRICE TO REACH A PPZ. ONLY AFTER I SEE A PRICE ACTION OFF A PPZ, I START LOOKING FOR EMA, FIBS, DIV, TREND LINES ETC.
Basically I do the same as you do. But I will not trade a PA setup which is into a PPZ or so. That’s the reason I first mark the PPZ (the place where price flips) before looking for PA setups.
Good work Johny.
And I must say I am getting better everyday…thanks to you John for introducing me to James thread 
Take care,
Ben
PS - The PPZs are all ways at round numbers…even if it’s not exactly placed.
Hey Tymen,
I hear what you’re saying and the pics you have posted have turned out great but I find this software even less time consuming, but each to their own. I like the way it can snap selected parts of the screen. Dont rule out being an MWsnap user
Cheers
Boca
Morning sports fans,
Ok, I know MACD is not an indicator that is reuired for this method but I notice that a lot of folks here and on FF James16 thread are using it.
On MT4 I have 3 MACD indicators and I notice that one is different from the other two. Please refer to the picture.
Any MACD specialists care to comment on the difference?
Cheers

Ok, So lets get to looking for good PA trades on the daily timeframe. Anyone seen this one forming on the EURGBP? Comments on the chart.
My biggest concern is that there are not many pips between the pin bar break high and the first PPZ. What’s your thoughts?
Cheers

Hi Bocajunior,
Not sure what you see, but my eyes tell me that the two lower MACDs are exactly the same
Umm…I think the higher one is a different kind…I have the lower ones in your chart. I think that’s the common one.
The J16 group doesn’t use any kind of indicators for their original usage (like crossover MA system etc).
The only two indicators you will see are moving averages and MACD.
The MACD is used only for spotting divergence.
The moving averages are basically for spotting S\R areas - Check the 365ema on your chart and notice how it’s acting as support and resistance (more effective on daily and weekly IMO).
Ben
PS - John correct me if I’m wrong somewhere in this post.
hey boca that chart looks more like an inside bar setup to me. there was a pinbar but it hasn’t broke to the upside so therefore no trade. now if the inside bar breaks to the upside and clears that pinbar from monday then it would be a nice setup. the one thing i see is alot of traffic so I would manage this one tight and move my stop to b/e by the time you hit that ppz.
ben you are correct sir. there is no need for any more than one indicator besides the ma’s. i think ray said after a while wo won’t even want the ma’s. im not positive it was ray though???
Anyway i barely even check for divegence and as soon as i do macd comes right off my chart again.
i like to keep my charts as clear as possible so even fibs comes right off. ill keep the ppz on there though.
I was thinking of what wizard said in that post and i am not sure I agree. I slept on it and here is my conclusion. ppz is ppz. its subjective yes but bar highs and bar lows will remain. i am not sure how I could fabricate this in my mind. for me to look over soooo many pairs and constantly keep up with all there ppz seems daunting especialy when i move into 4h tf. anyway i am open minded.
I have learned that I should approach this material with an open mind coz some of it is different than what i am used to for example I was always taught that 1:1 risk/reward is a minimum but those guys feel r:r is a myth and in fact some disagree with tharp’s work. i have accpeted this as truth. j16 is very high probability and high win rate so i need to focus on entrys and exits according to ppz and or confluence and the r:r thing would take care of itself.
this is a very successful system so i will continue to take guidance from those with more experience like wizard
MACD can be used in different ways hence the two different implementations you see although essentially they show the same information.
The top one shows the slow MACD and fast MACD lines and the histogram shows crosses and distance between the two lines.
The bottom one shows the slow MACD line and the histogram is the fast MACD.
Hi o990l6mh,
After you have placed all your ppz zones on your charts, you will only need to spend minimum time on your charts just to check are there any bar formation. As for me, the weekly charts are my favorites and I only need to check to analyze my charts on the weekend and have time for other stuffs on weekday or open up your charts on weekdays when you feel like trading. I feel newbies to this stuffs should start with weekly first than the daily as it is stress free and relaxed
Price action trading is simple and straightforward to me. So I remove all the indicators as they seem to make my eye confusing. Even Tess and Co dun use indicators. But if indicators are part of your game plan and it grows your account, then keep the indicators. J16 way of playing price action does not focus much on R:R while paying full attention to good trades setup and entry points and protecting your profits no matter how small it is, while other price action traders (like Tess and Co I assume) pay attention to R:R. Everyone has different way of approaching price actions but basically they look at the same things SR levels and price actions trigger.
That’s reassuring to read.
Does that mean that you don’t manually move your SL to BE during the week when the trade has gone into profit?
I had a long position on AUDCAD that I opened Sunday afternoon and everything was looking very nice until I opened up my charts this pm and found that the paper profit had turned into -15 pips as a bearish outside day seemed to be forming. I chickened out and closed it for a small loss. I feel like I should have moved the SL to BE sooner. That’s what I understand James16 does as he will go to lengths to avoid losses.
At the same time I’m thinking that maybe I should’nt have interfered, just let it play out and either hit my SL or my TP.
What do you do if you find there’s a reversal forming against your trade? Do you adjust the trade or do you let it run it’s course?
Input from JohnnyKanoo and others would also be welcome.
I hear you Mac, I’m somewhat struggling with the same dilemma.
On the one hand you have those who say move to BE asap so that you rarely lose a trade, on the other you have those who say ‘stick to your system and give the trade room to breathe’.
I’m starting to take the approach of move to BE once there is a significant profit. This is no set figure but I’m keeping in mind about 50-100 pips, or half of the target for the trade. My logic is once it’s moved that far away you’d be annoyed to watch it go to SL from there.
There is the risk that this will BE some profitable - but volatile - trades but the hope is it would be offset by breaking even on those that go your way somewhat and then reverse all the way to SL.
I’m also, when available to watch the trade, going to keep an eye on trades that go within 5% of the target and then start to show signs of reversal. I noticed this is quite often what NickB does - he watches his trades like a hawk and when he sees price stalling he hovers over the close button until it either continues or starts to reverse.
Hi o990l6mh,
As far as I know, Jim is teaching to go only for the A++++ setups which will in average occurs 3-4 times a month if you follow many pairs at higher time frames (daily and weekly). If you pick these WITH UNDERSTANDING OF SIMPLE PRICE PIVOT ZONES (S\R AREAS WHERE PRICE FLIPS), you will be able to take 9 successful trades out of 10. But here is the problem…Jim can sit and view his charts for months without entering even single one trade, cause he knows that when he will enter, a few tens of pips will make him ton of money. That’s because he is trading a very large account. But it is hard for small account holders.
Yes, one of the things I have noticed by reading through his thread, is that letting a winner turn into a loser is the worst thing in his book. Moving stop to BE is important.
When you enter a trade with an understanding of PPZs, you can easily identify the first place the price will may have trouble, and then move your stop to BE. Jim calls the trades which stop at BE winners.
For example, I’ll take your trade of the AUD\CAD and show you exactly why the price retraced and at which point you should have to move your stop to BE. As I see it, there is a reason for every single bar move on the charts. Never will happen something without a reason…that’s the nature of the markets.
I am may sounding like an experienced trader with this material, but please take note I am only 6 weeks into forex, and maybe two or three into the J16 material. It is very simple material after it sinks.
I would also wait for Ray_1 or JohnnyKanoo to confirm.
Here is how I read the market:

Ben
Let�s go one bar at a time and see the reason for each bar making highs and lows at its certain point. Take note I will begin from bar 4 because I need a bit historic price to base my decisions on. This is the AUD\CAD exactly what I have explained in the previous post, just zoomed in.
4 � Low ends in line with the high of bar 2 (old resistance now acting as support).
5 � Dropping to the line where the highs of box number 0 are. Than starts to go up and closes in line with the low of bar 2 (old support now resistance).
6 � Heading up to the line where the low of bar 3 is.
7 � Retraces to the lows of bars 5 and 6 which are now support (in the past resistance of box 0).
8 � After meeting support at bar 7, now time to rise up and reach the resistance which the bar lows 4 occurred in the past (old support now resistance�.pretty simple).
9 � Price keeping rising�but where will it stop? The answer is in line with the old resistance of the 3 and 4 bar highs. Now time to drop again after meeting resistance�price drops and makes a new low in line with the high of bar 7. (Old resistance now support. The price than goes up again and closes in line with the high of bar 8 and the lows of bars 4 (there are two bars for number 4.
10 prices retraces to the lows of 6, 7, 8 and highs of box 0, but the bar closes a bit before price reaches there.
11 � Bar 11 is completing the work of bar 10 and retraces to the level I have mentioned above (take note how the 365ema is acting as a wonderful support. I use moving averages only for that purpose�usually 150ema and 365ema). After meeting support, price rises and makes a line with the highs of bars 10, 8, 5, 2 and the low of bar 4 (awesome!! I am reading price like a book!).
12 - After meeting resistance, time to retrace and make a low where bar 7 formed old resistance, and bar 9 new support.
13 � Price breaks through the bunch of resistance and shooted up like a rocket�…where will it stop? Where will I want to take my profit? At the major PPZ I have marked after zooming out of my charts and looking for the major PPZ areas.
14 � Price retraces and stops at support. Where is that support? At old bunch of resistance which was created by the highs of bars 2, 4 and 9.
15\16 � price rises again and meets resistance at major PPZ which is now also the bar highs location of bars 13 and 14.
17 � Price retraces off the resistance and finds mini micro support at the high of bar 15.
18 � Retraces and finds support at the lows of bars 5, 6, 7, 10 and 12.
19 � Price goes up and finds resistance at the bar highs of 2, 5, 8, 10, 11 and lows of bars 4 and 13 � that is a PPZ � a place where price flips.
[B][U]Price action setups[/U]:[/B]
-
The two bars in box number 4 are inside bars. The highs of them are at a PPZ. So I will trade a break of them short. Ok I took short on the breakout. When to exit? Where price will have trouble? Exactly where it suppose to have. At the highs of bars in box number 0.
-
Bars 6 and 7 are inside bars. Will I trade them long? No. There is a PPZ right above � lows of previous bars 3 and 4. There is no room for price to go long unless it breaks out, but then I will wait for that breakout before I enter a trade.
-
Bar 9 is a PB off a PPZ. I wouldn�t take it because there is no room for it to move. This time it dropped lower than bars 5, 6, 7, 8, lows�.but rarely happen.

Hope that helps!!
It took me a lots of time to write and draw all of these in the two last posts
But that’s completely fine. I did it cause I do it all day long when I have a bit space of time. (this time I just uploaded it). Before two weeks I didn’t have a clue. I just practice and practice…eventually it sinks and now I even see them automatically without thinking a lot when I open my charts.
Ben
Benji,
You’re certainly not like the ordinary newbies here, which is a very good thing 
I will shortly delve into your detailed post. That requires focus, so I’m not sure I should read it tonight.
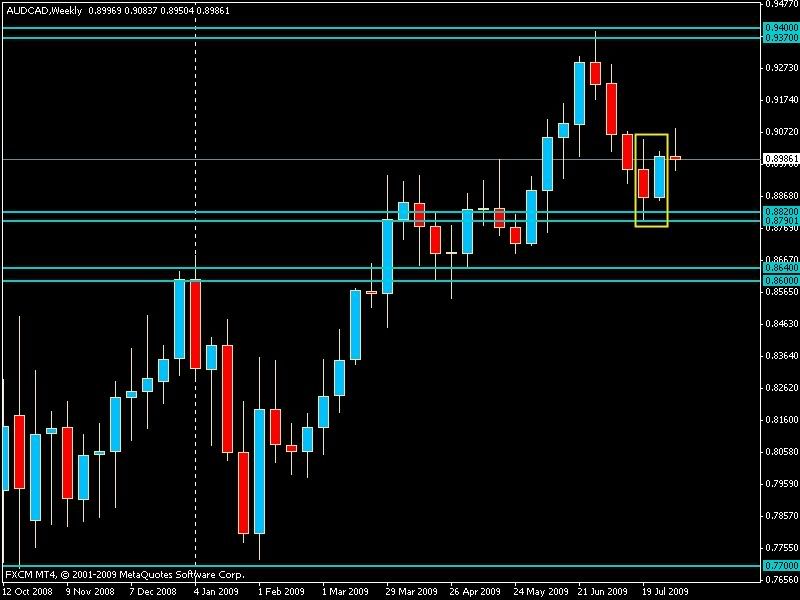
I just wanted to post this chart up. It’s the weekly chart of AUDCAD that I took the trade from. I’ve boxed the two weekly candles that added together make up a pretty good (not A++ I know) two bar reversal, situated at a support, sorry, I mean PPZ.
As has been said this would then at least have been one of Jim’s BE “winners”, but due to inexperience it turned out as a 0.2% loser for me.
However, only time will tell if I was hasty in closing it, maybe it will turn again and go north to my original TP.
Here’s the chart: