Early in 2020, the whole transportation industry saw an amazing decline across the marketplace. Many of the company’s stock trade lower into level only seen during the 2009 financial crisis. During the decline, we express to the world, this was a tremendous chance to buy the dip and that will take time to see or develop a low. We have seen already world indices like $SPY trading into new all-time highs. But many within the transportation sectors are lagging when related to Indices and also other sectors like Technology. We did an article a few months ago mentioning that Southwest Airlines (LUV) was showing bullish sequences and supporting the sector. As we were expected, the Airline has been trading higher and then Jet Blue enter the equation because Southwest was leading.
But now Jet Blue which was lagging is showing the same bullish sequences supporting the sector. We at elliottwave-forecast.com look at the market, as a whole, and always relate the instruments. And divide them by sectors, groups to forecast the market overall. Jet Blue’s opportunity was explained in the following article. In which we covered the whole sector and the great opportunity it was.
The Market-based in the Elliott wave Theory advance in sequences of 5-9-13-17 when impulse or corrective in 3-7-11, both sequences agree in swing number five. Every time you see either a five waves advance into a new cycle makes the side with the five waves in control. Here is a chart of a five waves advance in the Elliott wave Theory:
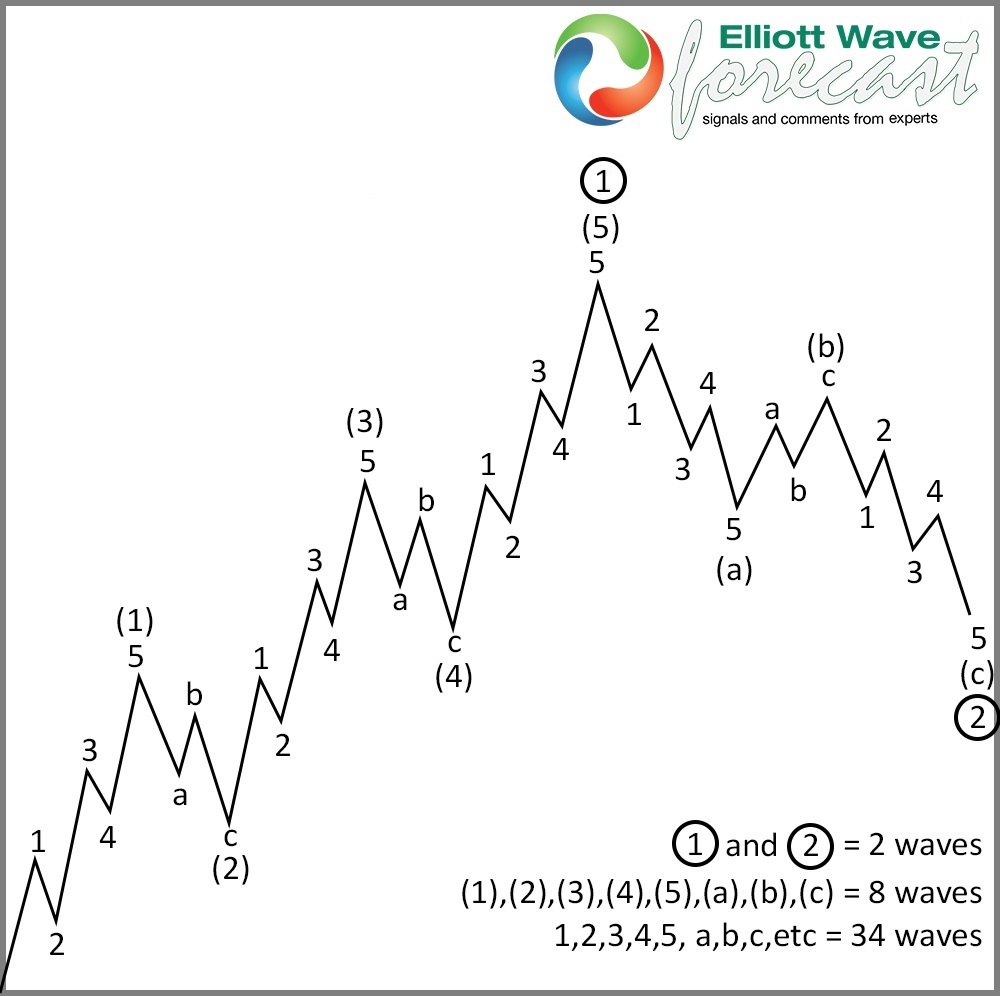
As we can see after five waves off the lows, the Marke does three waves pullback and trade with the previous cycle.
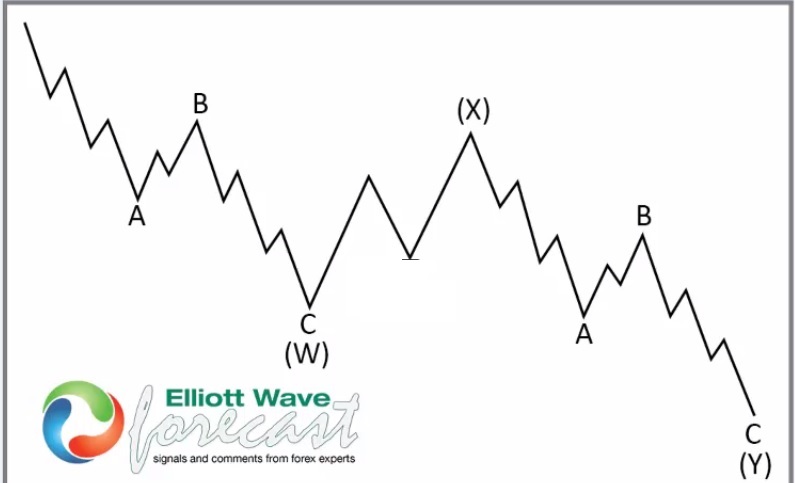
The other idea or sequence is the corrective sequence. The idea is that the market trade in 3-7-11, but in order to reach the 7 swings, first needs to pass through swing number 5. A seven swing structure is called WXY, which does show three swings into the W. Then three swings in the X and another three swings in the Y. So, W-X and first swing of the Y created five swings and because needs to trade into the swing makes the side with the five swings in control.
The following chart is a representation of the WXY with the seven swing structure:
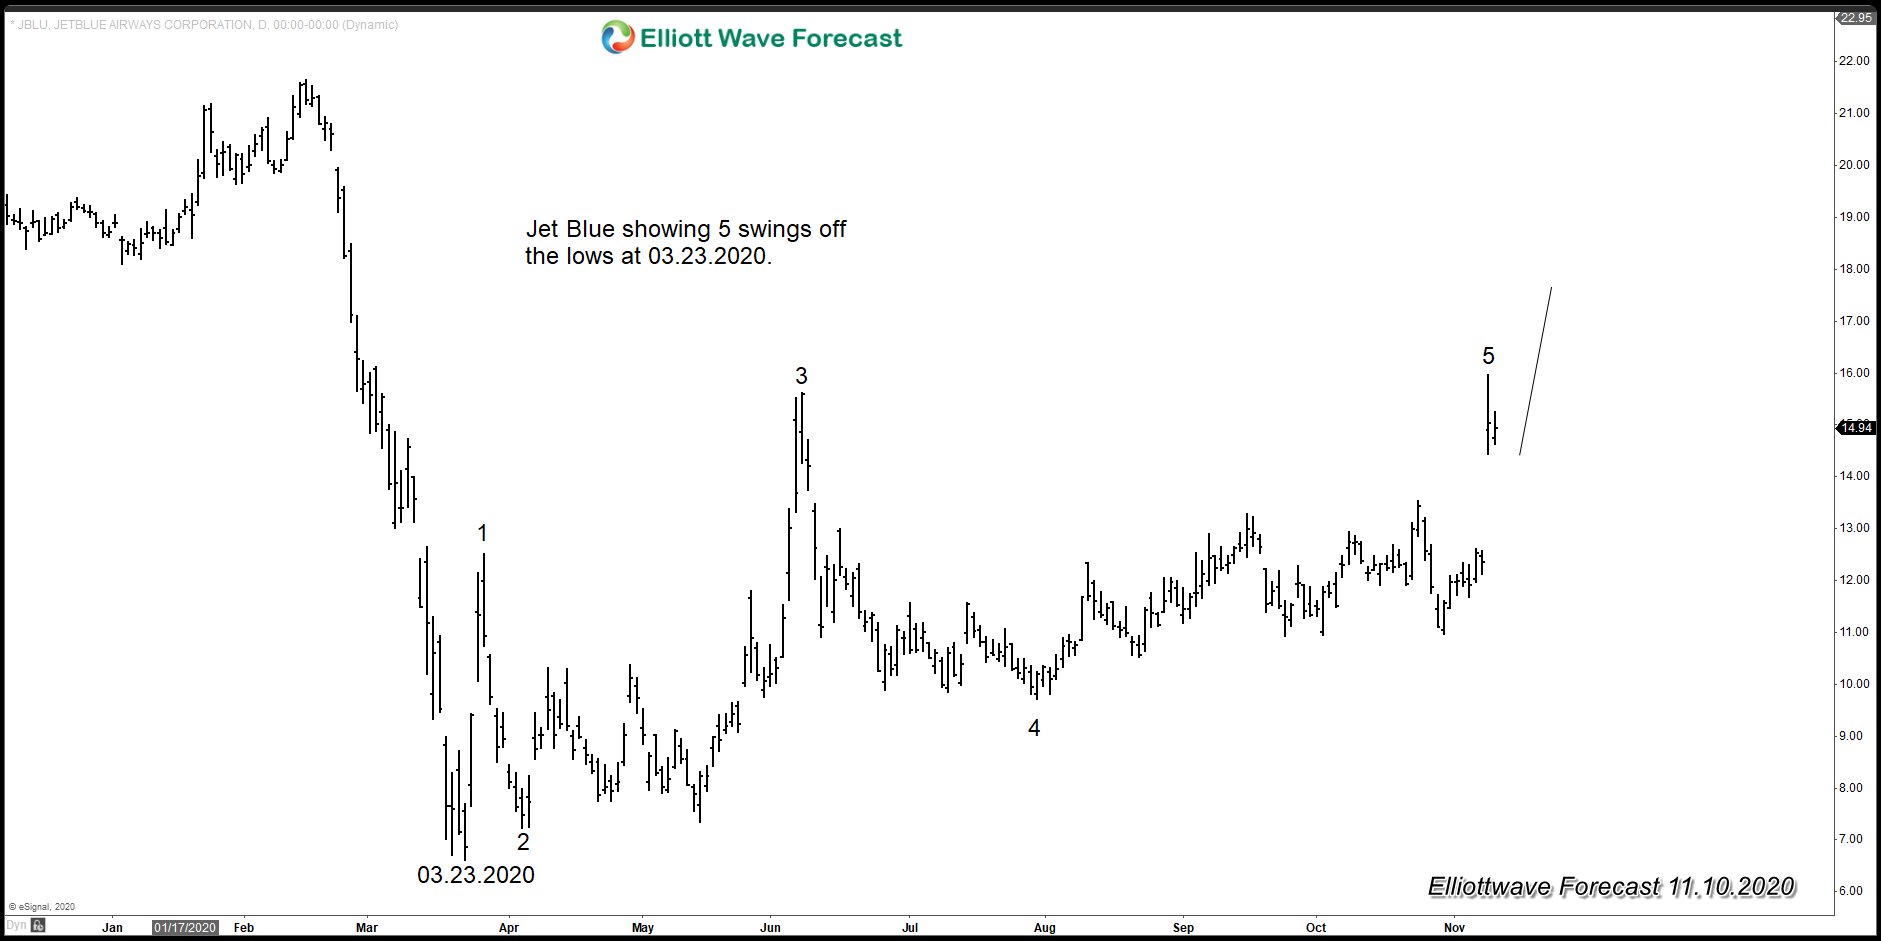
Jet Blue is showing five swings since the lows at 03.23.2020, as we showing in the following chart:
Jet Blue Elliott Wave Chart
Now Jet Blue should see more upside in either of the two possible scenarios. Either, if the symbol will be within the process of an impulse higher or if the advance will prove corrective. As we have mentioned above Southwest was leading the sector and now it comes to Jet Blue. Overall every single move comes with a process, and we have learned over the years. That trade what the market is giving us and not follow the theory or draw a conclusion because of the nature of the recovery now looks overlapping and corrective.
The theory always allows an answer to every move. The reason why we relied on the sequences, and the correlation among the sectors and groups. As of right now, we take the five swings higher from 03.23.2020 lows and push the upside, the Elliott wave count will be developing with the data. Times have changed, so we have adjusted the Theory and implement all these changes and corrections to make it better.