Since the crash of March 2020, all stocks have tried to recover what they lost and JNJ was no exception. Johnson & Johnson did not only recover the lost, but It also reached historic highs. Now, we are going to try to build a wedge from the March 2020 lows with a target above $176.
In the chart we can clearly see that after the fall of March 2020, JNJ had a strong and rapid recovery. We call this movement wave ((1)). The for several months it was within a large range forming a double correction until it continued with the rally. This range was the wave ((2)). (If you want to learn more about Elliott Wave Theory, please follow this link: Elliott Wave Theory).
JNJ Daily Chart
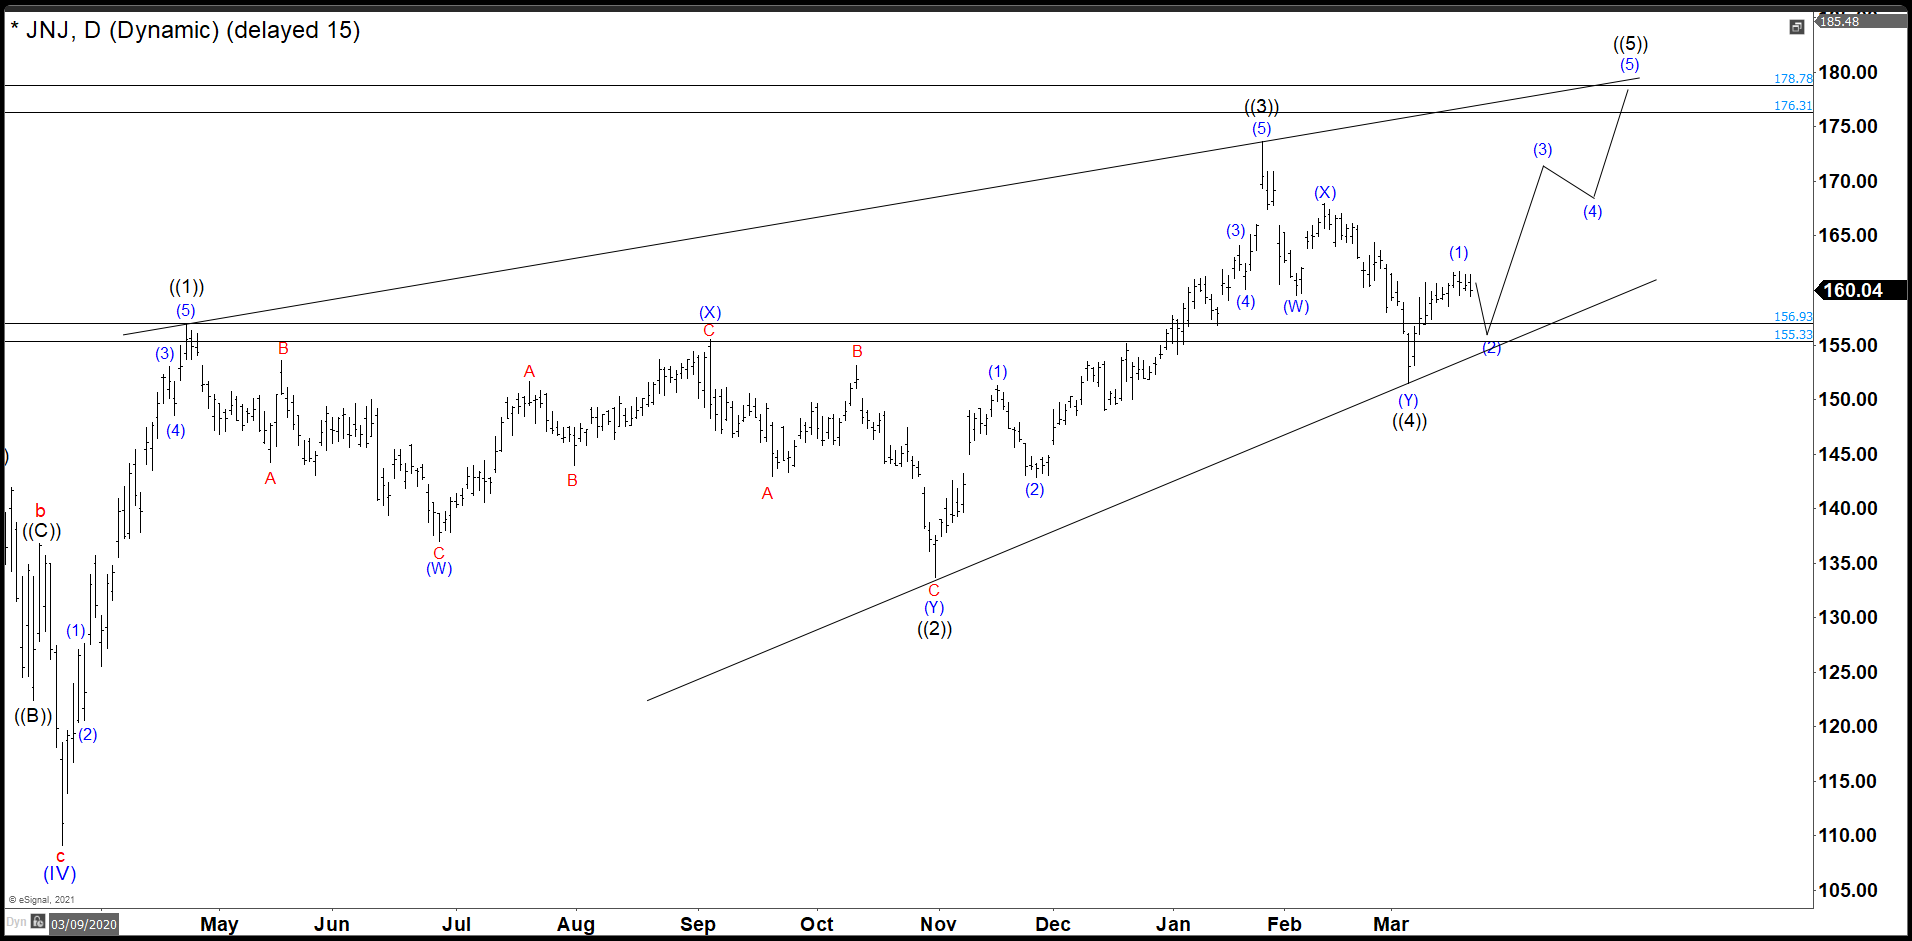
JNJ continued the rally breaking the peak of the wave ((1)) indicating that we are already on wave ((3)). This wave ((3)) had its highest point at 173.69 where JNJ was rejected by the market. This rejection did another double correction structure and overlaps the wave ((1)) zone to end the wave ((4)). This fact and the long time that wave ((2)) took to complete, gives us the guideline to determine that the structure that JNJ is building is a diagonal.
We are currently in the last swing to complete the diagonal. This swing should be an impulse as happened with waves ((1)) and ((3)). Wave (1) of this new impulse seems finished and we are correcting on wave (2). This wave (2) should bounce off from 155-157 zone to continue the bullish move. This would lead us to look for 3 more swings to complete the wave ((5)) and the diagonal that began in March 2020. This diagonal should end the structure within the area of 176 - 179 dollars per share.